|
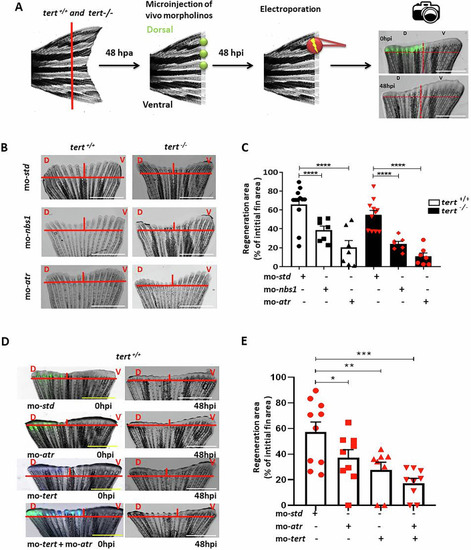
Inhibition of nbs1 and atr affects adult caudal fin regeneration. (A) Schematic representation of vivo fluorescent morpholino microinjection into the dorsal area of the caudal fin after 48 hpa. The microinjected area is then electroporated. The ventral area is used as a control of normal regeneration. After 48 h post injection (hpi), the regeneration area was calculated. Scale bar, 1 mm. (B) Representative pictures of caudal fin regeneration after 48 h post-morpholino microinjection. Scale bar, 4.6 mm. (C) Regeneration area of caudal fin in tert+/+ and tert−/− genotypes with nbs1 and atr knockdown. n = 3 experiments. Each dot represents a biological replicate. (D) Representative images of caudal fin at 0 hpi of vivo morpholinos (standard and atr in green and tert in blue) in the dorsal half (D), and after 48 hpi. (V) uninjected ventral half. Scale bar, 1 mm. (E) Regeneration area of caudal fin in wild-type fish with atr and/or tert knockdown. n = 3 experiments. Each dot represents a biological replicate. Exact p values are p = 0.0291 for control vs mo-atr, p = 0.0053 for control vs mo-tert and p = 0.0002 for control vs mo-atr + mo-tert. All data were mean + s.e.m. *P < 0.05, **P < 0.01, ***P < 0.001, and ****P < 0.0001 for one-way ANOVA plus Sidak´s post hoc test in (C) and plus Holm–Sidak´s post hoc test in (E). When exact p values are not indicated is because GraphPad Prism software does not show it. Source data are available online for this figure.
|