|
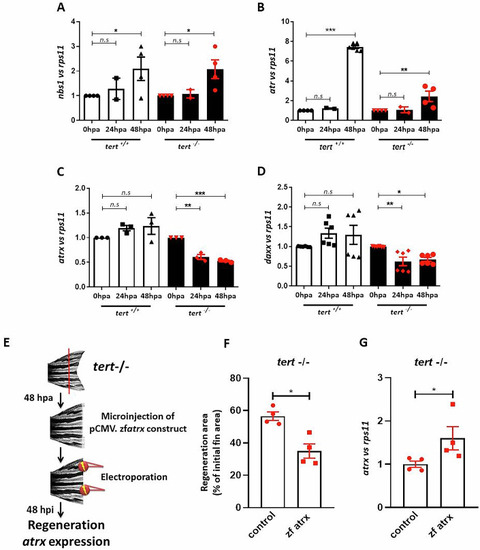
The expression of ALT-associated genes is modulated in regenerative tissue of wild type and telomerase-deficient zebrafish. (A) nbs1 expression normalized to rps11 expression in regenerative tissue from wildtype and telomerase-deficient adult zebrafish at 24 and 48 hpa. n = 4 experiments. Exact p values 0 hpa vs 48 hpa are p = 0.04 in tert+/+ and p = 0.044 in tert−/−. (B) atr expression normalized to rps11 in regenerative tissue from tert+/+ and tert−/− adult zebrafish at 24 and 48 hpa. n = 4 experiments. Exact p value 0 hpa vs 48 hpa in tert−/− is p = 0.0019. (C) atrx expression normalized to rps11 in regenerative tissue from tert+/+ and tert−/− adult zebrafish at 24 and 48 hpa. n = 3 experiments. Each dot represents a biological replicate. Exact p values in tert−/− are p = 0.0097 for 0 hpa vs 24 hpa are p = 0.0025 for 0 hpa vs 48 hpa. (D) daxx expression normalized to rps11 in regenerative tissue from tert+/+ and tert−/− adult zebrafish at 24 and 48 hpa. n = 6 experiments. Exact p values in tert−/− are p = 0.0056 for 0 hpa vs 24 hpa are p = 0.0483 for 0 hpa vs 48 hpa. (E) Schematic diagram of the workflow of the experiment. Regenerative fins of tert−/− fish were microinjected 48 h post amputation (hpa) with a plasmid overexpressing the zebrafish atrx gene, and then electroporated. Forty-eight hours post injection (hpi), regenerated areas were quantified (F) and atrx gene expression was assessed (G). n = 3 experiments. Each dot represents a biological replicate. Exact p values are p = 0.0286 in (F) and p = 0.0286 in (G). All data were mean + s.e.m. n.s. not significant. *P < 0.05, **P < 0.01, and ***P < 0.001 for one-way ANOVA plus Dunnett’s post hoc test in (A–D). *P < 0.05 for the Mann–Whitney test in (F, G). When exact p values are not indicated is because GraphPad Prism software does not show it. Source data are available online for this figure.
|