
FIGURE
Fig. 2
- ID
- ZDB-FIG-251208-36
- Publication
- Erradhouani et al., 2025 - A new alternative method using cyp3a65 expression in transgenic zebrafish embryos to assess metabolic endocrine-disrupting chemicals in the intestine
- Other Figures
- All Figure Page
- Back to All Figure Page
Fig. 2
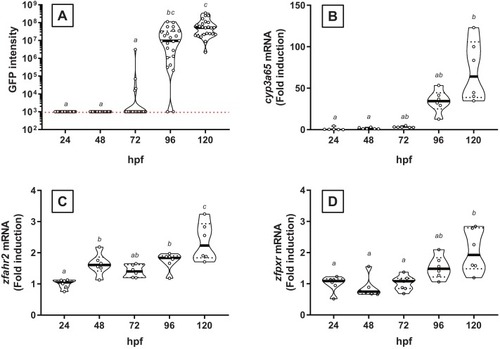
GFP fluorescence intensity in tg(cyp3a65:GFP) embryos and mRNA expression of cyp3a65, zfahr2 and zfpxr during embryonic development (A) GFP intensity in individual embryos (n = 21 embryos per condition minimum) from 24 to 120 hpf in control condition (DMSO 0.01 %) and mRNA expression of (B) cyp3a65, (C) zfahr2 and (D) zfpxr in pooled zebrafish embryos (n = 5 embryos/pool) in same condition. a, b, c: conditions sharing the same letter are not statistically different (p < 0.05). Red dotted line (A) indicates individuals under the detection limit. |
Expression Data
Expression Detail
Antibody Labeling
Phenotype Data
Phenotype Detail
Acknowledgments
This image is the copyrighted work of the attributed author or publisher, and
ZFIN has permission only to display this image to its users.
Additional permissions should be obtained from the applicable author or publisher of the image.
Full text @ Environ. Int.