
Fig. 1
- ID
- ZDB-FIG-251208-35
- Publication
- Erradhouani et al., 2025 - A new alternative method using cyp3a65 expression in transgenic zebrafish embryos to assess metabolic endocrine-disrupting chemicals in the intestine
- Other Figures
- All Figure Page
- Back to All Figure Page
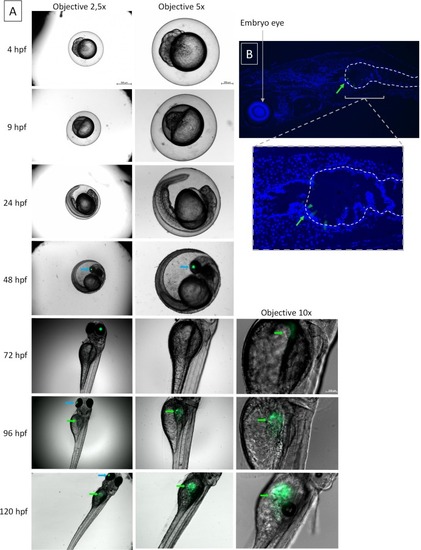
Fluorescence expression in developing zebrafish embryos. (A) Optical microscopy images of zebrafish embryos from 4 to 120 hpf in breeding water. (B) GFP immunohistochemistry staining at 120 hpf showing localization in the anterior part of the intestine in control condition (green) and nucleus DNA staining (blue). Blue arrow shows CFP fluorescence in the eye, green arrow shows GFP fluorescence in the intestine. Pictures are reworked in terms of contrast to highlight the GFP fluorescence signal over time. (For interpretation of the references to colour in this figure legend, the reader is referred to the web version of this article.) |