
Figure 1
- ID
- ZDB-FIG-251107-70
- Publication
- Li et al., 2025 - PCSK9 Loss-of-Function Disrupts Cellular Microfilament Network via LIN28A/HES5/JMY Axis in Neural Tube Defects
- Other Figures
- All Figure Page
- Back to All Figure Page
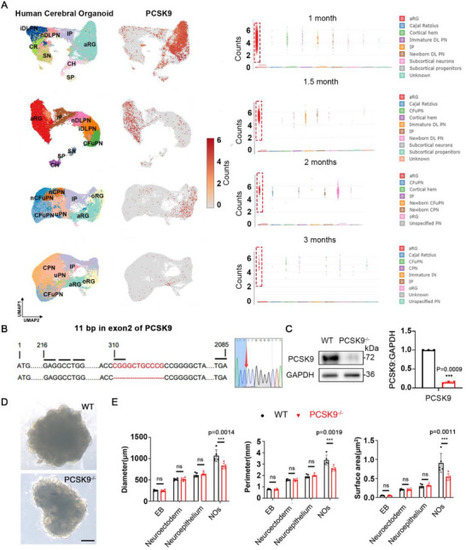
PCSK9 loss leads to changes in NOs size and NT structure. A) Cell‐type clusters, feature plot showing PCSK9 expression (left) and statistical results (right) in human cerebral organoids at different developmental time points. Dataset and cluster annotations were obtained from Uzquiano et al (2022), and the clustering and annotation from the original publication are kept unchanged. aRG: apical radial glia; oRG, outer radial glia; IP: intermediate progenitor; DL, deep‐layer; PN, projection neurons; iDLPN, immature DLPN; nDLPN, newborn DLPN; CFuPN, corticofugal projection neuron; CPN, callosal projection neuron; IN, interneurons; CR, cajal retzius; SN, subcortical neurons; CH, cortical hem; SP, subcortical progentors. B) CRISPR/Cas9‐mediated gene editing of the PCSK9 locus in ESCs resulted in an 11‐bp depletion in exon 2. C) Western blotting (WB) and quantification of PCSK9 expression in WT and PCSK9‐/‐ ESCs; n = 3 independent experiments. D) Representative images of WT and PCSK9‐/‐ NOs; scale bars, 1 mm. E) Quantification of diameter, perimeter, and surface area of NOs; n = 5 individual NOs. Values were mean ± SD. Statistical significance was determined using an unpaired two‐tailed Student's |