FIGURE

Fig. 6

ID
ZDB-FIG-251026-7
Publication
Burendei et al., 2025 - Structure-guided discovery of Otopetrin 1 inhibitors reveals druggable binding sites at the intrasubunit interface
Other Figures
All Figure Page
Back to All Figure Page
Fig. 6

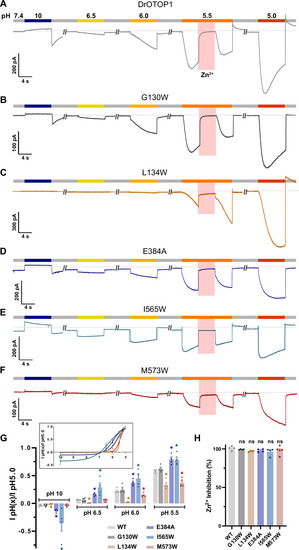
Outer, central, and C-domain pocket mutants that reduce inhibitor efficacy also alter channel gating.

AF Representative traces of currents from HEK-293 cells expressing WT (A), G130W (B), L134W (C), E384A (D), I565W (E), and M573W (F) over a pH range of 10 to 5.0. 1 mM Zn2+ (pH 5.5) was applied during the pH 5.5 stimulus as indicated. G Current magnitudes normalized to response to pH 5.0, from experiments as in (AF) (n = 4-5 cells per construct). Inset: Fitted pH50 curves for WT and mutant channels. pH50s were as follows. WT: pH 5.64, G130W: pH 5.68, L134W: pH 5.43, E384A: pH 5.97, I565W: pH 6.36, M573W: pH 5.43. H Inhibition by 1 mM Zn2+ from experiments as in (AF), (n = 4-5 cells per construct). Significance was determined in (G) using non-parametric two-tailed Mann-Whitney tests to compare cumulative ranks to WT DrOTOP1 at the same pH. Significance was determined in (H) using one-way ANOVA with Dunnett’s correction compared to WT DrOTOP1. All data presented as mean ± SEM. *P < 0.05, **P < 0.01, ***P < 0.001, ****P < 0.0001 for all statistical tests. Experiments were performed by holding cells at Vm = −80 mV. Source data are provided as a Source Data file.

Expression Data

Expression Detail
Antibody Labeling
Phenotype Data

Phenotype Detail
Acknowledgments
This image is the copyrighted work of the attributed author or publisher, and ZFIN has permission only to display this image to its users. Additional permissions should be obtained from the applicable author or publisher of the image. Full text @ Nat. Commun.