|
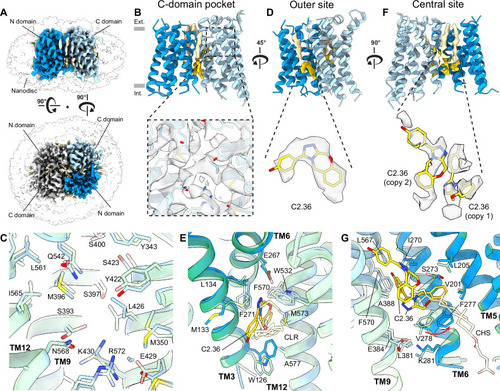
Cryo-EM structure of DrOTOP1 with inhibitor C2.36. A Side (top) and top (bottom) views of cryo-EM structures of DrOTOP1 in complex with C2.36 (DrOTOP1_C2.36), with one monomer colored blue (N-domain) and light blue (C-domain), the other monomer colored light gray, bound-lipids colored tan, small molecules colored gold, and the nanodisc micelle shown as a transparent surface. B Side view of the DrOTOP1_C2.36 model, with density for bound lipids and small molecules shown. The inset shows the C-domain pocket with the cryo-EM map shown as a gray transparent surface. Gray rectangles indicate the height of the lipid bilayer, with the extracellular side (Ext.) on top and the intracellular side (Int.) below. C View of the C-domain pocket with DrOTOP1_apo (transparent) and DrOTOP1_C2.36 aligned and superimposed, with pocket lining residues labeled and shown as sticks, and backbones shown as cartoons to highlight conformational differences or the lack thereof. D 45° rotated side view from (B) shows the outer site, with the inset showing non-protein density found in the outer site as transparent surfaces, with the inhibitor C2.36 modeled in, shown as sticks. E View of outer site comparing DrOTOP1_C2.36 with C2.36 bound and DrOTOP1_apo with cholesterol (CLR) bound. Pocket lining residues are labeled and shown as sticks. F 90° rotated view from (D) shows the central site, with the inset showing non-protein density found in the central sites as transparent surfaces, with inhibitors C2.36 modeled in the density, shown as sticks. G View of central site comparing DrOTOP1_C2.36 with two copies of C2.36 bound and DrOTOP1_apo with CHS bound. Pocket lining residues are labeled and shown as sticks. Movement of the side chain of F277 is indicated with a red arrow.
|