|
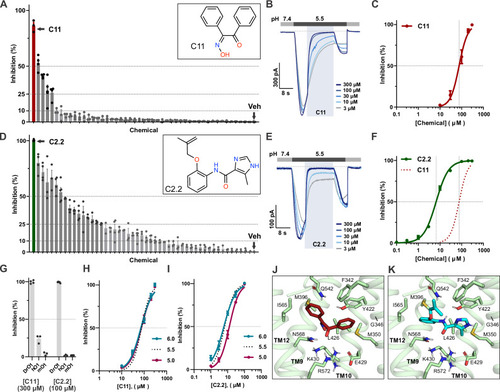
Screening of small molecules against DrOTOP1 identifies inhibitors. A, D Inhibition of pH 5.5-induced currents by compounds tested (at 200 μM) from screen 1 (A) and screen 2 (D) measured with whole-cell patch-clamp recording from HEK-293 cells expressing DrOTOP1. n = 3–5 cells per compound. C11 (red bar), C2.2 (green bar), and 0.2% DMSO control (Veh, gray bar) are indicated. Compound names are omitted. Bars in dark gray indicate molecules that inhibit DrOTOP1 by > 25%. Insets show chemical structures of C11 and C2.2. B Representative traces of HEK-293 cells expressing DrOTOP1 showing dose-dependent inhibition by C11 at pH 5.5. C Data from experiments as in (B). Data fit with a Hill slope = 2.21 and IC50 of 76.3 μM. n = 4 cells. E Representative traces of HEK-293 cells expressing DrOTOP1 showing dose-dependent inhibition by C2.2 at pH 5.5. F Data from experiments as in (E). Data fit with a Hill slope = 1.52 and IC50 of 6.67 μM. n = 8 cells. G Inhibition of DrOTOP1, human OTOP1 (hOTOP1), and mouse OTOP1 (mOTOP1) in HEK-293 cells by C11 and C2.2. n = 4 (C11) and 5 (C2.2) cells for DrOTOP1, n = 3 cells for hOTOP1, and n = 3 cells for mOTOP1. H, I Dose-dependent inhibition of C11 (H) and C2.2 (I) in HEK-293 cells expressing DrOTOP1. Currents were evoked at pH 6.0 and pH 5.0. pH 5.5 data from (C, F). Data were fit with a Hill slope. C11: pH 6.0 = 71.5 μM, h = 1.67 and pH 5.0 = 75.2 μM, h = 1.88. n = 5 cells (pH 6) and n = 7 cells (pH 5). C2.2: pH 6.0 = 5.99 μM, h = 1.25 and pH 5.0 = 12.6 μM, h = 1.53. n = 8 cells (pH 6) and n = 8 cells (pH 5). Docked poses for C11 (dark red) (J) and C2.2 (cyan) (K) in the C-domain pocket. The DrOTOP1 model (light green) is shown as a transparent cartoon and sticks, with pocket-lining residues labeled. All data are presented as mean ± SEM. All experiments performed by holding cells at Vm = −80 mV. Source data are provided as a Source Data file.
|