
Fig. 6
- ID
- ZDB-FIG-251010-59
- Publication
- Pan et al., 2025 - A novel phex gene variant causes non-syndromic tooth agenesis
- Other Figures
- All Figure Page
- Back to All Figure Page
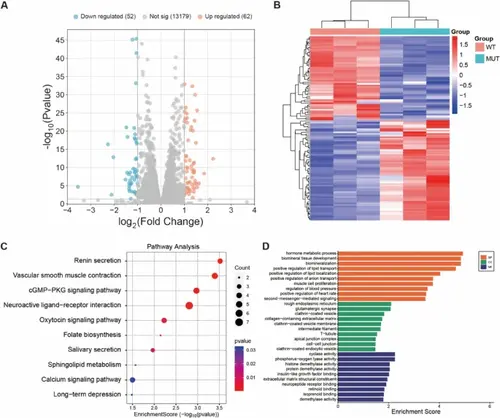
A Volcano plot of differentially expressed genes (n = 3 technical replicates per group, single RNA-seq experiment). Green dots represent down-regulated genes, and red dots represent up-regulated genes (|log2FC|≥ 1 and adjusted p ≤ 0.05). B Heatmap showing the expression levels of transcripts in samples from the DPSCs-MUT and DPSCs-WT (n = 3 technical replicates per group). Red color refers to upregulation, and blue color refers to downregulation of gene transcription. C KEGG pathway analysis ranked the top 10 KEGG pathways (|log2FC|≥ 1 and adjusted p ≤ 0.05, based on 3 technical replicates per group). D Go results of biological process, cellular component, and molecular function (enrichment analysis based on differentially expressed genes with adjusted p ≤ 0.05, using 3 technical replicates per group). RNA sequencing was performed using Illumina platform with > 20 million clean reads per sample. Differential expression analysis was conducted using DESeq2 with Benjamini-Hochberg correction for multiple testing. Statistical significance: *adjusted p < 0.05, **adjusted p < 0.01, ***adjusted p < 0.001 |