|
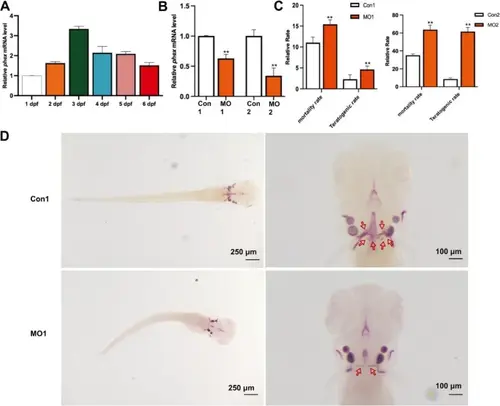
A Phex expression at different stages post-fertilization in zebrafish (n = 20 embryos per time point, 3 independent experiments). B Validation of Phex expression inhibition efficiency (n = 15 embryos per group, 3 independent experiments). C Statistics depicting mortality and malformation rates at varying concentrations of MO (n = 120 embryos total, pooled from 3 independent experiments with n = 40 per experiment). D Microinjection of zebrafish eggs and observation of tooth development at 6 days post-fertilization (dpf) via Alizarin Red staining (n = 30 embryos per group, 3 independent experiments). Scale bars: 250 μm (embryo images), 100 μm (tooth staining images). Data represent mean ± SEM. Statistical analysis performed using Student’s t-test for pairwise comparisons and one-way ANOVA for multiple group comparisons. *p < 0.05, **p < 0.01, ***p < 0.001 vs. control group
|