
Fig. 6
- ID
- ZDB-FIG-250925-6
- Publication
- Olaya et al., 2025 - Distinct cellular and reproductive consequences of meiotic chromosome synapsis defects in syce2 and sycp1 mutant zebrafish
- Other Figures
- All Figure Page
- Back to All Figure Page
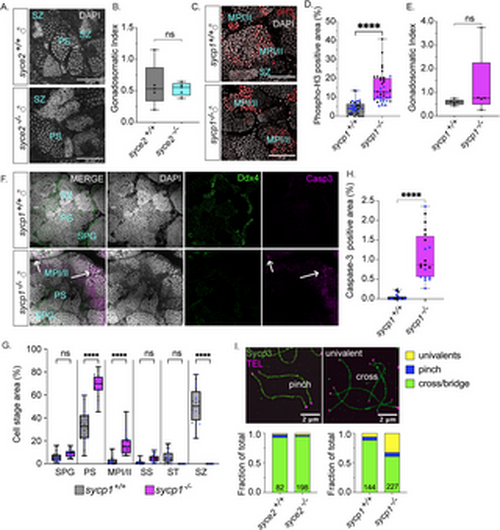
Spermatogenesis arrests at metaphase I/II in sycp1-/- males but not syce2-/- males. (A) Whole mount testes from adult (> 60 dpf) syce2+/+ and syce2-/- males stained with DAPI (gray). Examples of primary spermatocytes (PS) and spermatozoa (SZ). Scale bar = 50 µm. (B) The gonadosomatic index of syce2+/+ (n = 5) and syce2-/- (n = 5) testes. Unpaired t-test; ns = not statistically significant, * = p < 0.05. (C) Whole mount testes from adult (> 60 dpf) sycp1+/+ and sycp1-/- males stained with DAPI (gray) and phospho-Histone H3 (pH3; red). Examples of spermatocytes in metaphase I or II (MPI/II) and spermatozoa are noted. Scale bar = 50 µm. (D) Percent of cyst area represented by phospho-histone H3 staining. Multiple image fields (n = 20) were analyzed each for wild-type sycp1+/+ testes (n = 2) and sycp1-/- mutant testes (n = 2). Different colors represent data from same testis. Unpaired t-test; **** = p < 0.0001. (E) The gonadosomatic index of sycp1+/+ (n = 5) and sycp1-/- (n = 5) testes. Unpaired t-test; ns = not statistically significant, * = p < 0.05. (F) Whole mount testes from adult (> 60 dpf) sycp1+/+ (top) and sycp1-/- (bottom) males stained with DAPI (gray), Ddx4 (green) and cleaved caspase-3 (magenta). Arrows represent apoptotic nuclei. Scale bar = 50 µm. (G) Percent of cyst areas including spermatogonial cells (SPG), primary spermatocytes (PS), metaphase I/II (MPI/II), secondary spermatocytes (SS), spermatids (ST), and spermatozoa (SZ). Multiple image fields (n = 20) were analyzed each for wild-type sycp1+/+ testes (n = 2) and sycp1-/- mutant testes (n = 2). Measurements from individual testes shown in gray or blue circles. One-way ANOVA testing with Šidák’s multiple comparisons; **** = p < 0.0001; ns = not statistically significant, * = p < 0.05. (H) Percent of cyst area with cleaved caspase-3 positive cells. Multiple image fields (n = 20) were analyzed each for wild-type sycp1+/+ testes (n = 2) and sycp1-/- mutant testes (n = 2). Measurements from individual testes shown in black or blue circles. Unpaired t-test; **** = p < 0.0001. (I) Proportion of distinguishable chromosome configurations (cross/bridge bivalents, pinch bivalents and univalents) among diplotene (wild-type), pachytene-like (syce2-/-) and pachytene/diplotene-like (sycp1-/-) chromosomes. syce2+/+ (n = 82) and syce2-/- (n = 198); Chi-squared test: ns = not significant, ns = p < 0.05. sycp1-/- (n = 144) and sycp1+/+ (n = 227); Chi-squared p < 0.0001. Data is compiled from chromosomes spreads performed over seven independent experiments. |