
Fig. 5
- ID
- ZDB-FIG-250925-5
- Publication
- Olaya et al., 2025 - Distinct cellular and reproductive consequences of meiotic chromosome synapsis defects in syce2 and sycp1 mutant zebrafish
- Other Figures
- All Figure Page
- Back to All Figure Page
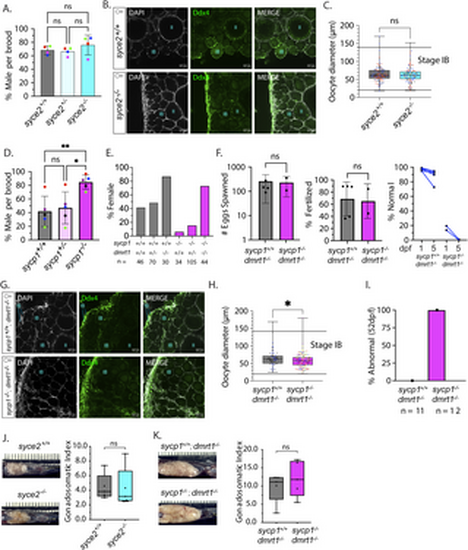
Normal sex ratios and gonad development in syce2-/- mutants but not sycp1-/- mutants. (A) Percentage of animals developing as male in syce2+/+, syce2+/- and syce2-/- genotypes from four independent experiments. Each data point indicates the percentage of males within each genotype out of total animals per brood: Blue (S4348) n= 99; Pink (S4461) = 342; Green (S4634) n = 318; Red (S4643) = 328. Significance was determined using repeated measures one-way ANOVA testing with Šidák’s multiple comparisons test; ns = not statistically significant. (B) Whole mount ovaries from 45 dpf syce2+/+ and syce2-/- females imaged using confocal microscopy. Ovaries are stained for DAPI (gray) and Ddx4 (green). Scale bar = 50 µm. (C) Calculated diameters of individual Stage IB oocytes from 45 dpf ovaries syce2+/+ (n = 3; 118 total oocytes) and syce2-/- (n = 3; 104 total oocytes). Different colors represent cells from different ovaries. Significance was determined using an unpaired t-test. ns = not statistically significant, * = p < 0.05. (D) Percentage of animals developing as male in sycp1+/+, sycp1+/- and sycp1-/- genotypes from five independent experiments. Each data point indicates the percentage of males within each genotype out of total animals per brood: Purple (S3667) n = 183; Blue (S4297) n= 237; Red (S4347) = 112; Black (S4395) n = 167; Green (S4434) n= 382. Significance was determined using repeated measures one-way ANOVA testing with Šidák’s multiple comparisons test; ns = not statistically significant, * = p < 0.05. (E) Percent females among genotypes of progeny from a sycp1-/+; dmrt1+/- incross. n values are given for each genotype. (F) Number of eggs spawned by sycp1+/+; dmrt1-/- (n = 5) and sycp1-/-; dmrt1-/- (n = 2) females (left) and the percent fertilized by AB males (center). Significance was determined using an unpaired t-test. ns = not statistically significant, * = p < 0.05. Percent of normal progeny (right) at 1 and 5 dpf for each cross. (G) Whole mount ovaries from 45 dpf sycp1+/+ and sycp1-/- females in a dmrt1-/- background stained with DAPI (gray) and Ddx4 (green). Scale bar = 50 µm. (H) Calculated diameters of individual Stage IB oocytes from two 45 dpf sycp1+/+; dmrt1-/- ovaries (n = 2; 81 total oocytes) and six 45 dpf sycp1-/-; dmrt1-/- ovaries (n = 6; 151 total oocytes). Different colors represent cells from different ovaries. Unpaired t-test; Significance was determined using an unpaired t-test. **** = p < 0.0001. (I) Percent abnormal ovaries by size by visual inspection dissected from 52 dpf fish. sycp1+/+; dmrt1-/- (n = 11) and sycp1-/-; dmrt1-/- (n = 12). (J) Ovaries from adult syce2+/+ and syce2-/- adult females (age = 11 months) in situ (left) and the gonadosomatic index of each (100 X gonad mass/total body mass) (right). N = 5 for each genotype. Unpaired t-test; ns = not statistically significant, * = p < 0.05. (K) Ovaries from sycp1+/+; dmrt1-/- and sycp1-/-; dmrt1-/- adult females (age = 13 months) as described in part J. N = 5 for each genotype. Unpaired t-test; ns = not statistically significant, * = p < 0.05. Note that the difference in ovary size from J is due to lower tank density and a greater amount of food per fish. |