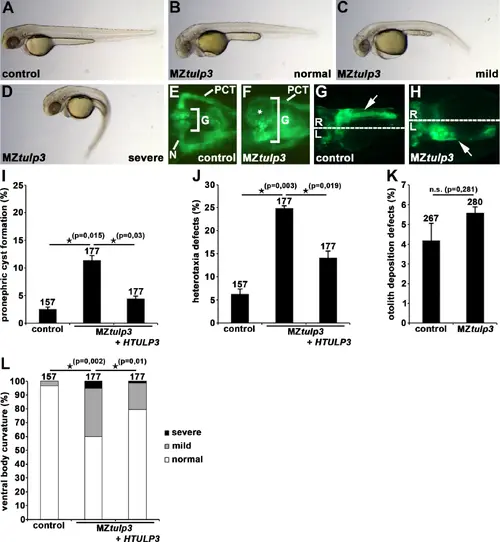
Tulp3 knockout analyses of cilia-related phenotypes during zebrafish embryogenesis. (A-D) Bright-field images of MZtulp3 embryos (B-D) and respective control embryo (A) at 2dpf. In comparison to the control embryos, MZtulp3 embryos display different degrees of ventral body curvature. (E–K) Knockout of Tulp3 leads to pronephric cyst formation (white star in (F)) and altered positioning of the exocrine pancreas (white arrow in (H)) at 2dpf as shown in a dorsal view with anterior to the left of a MZtulp3; li1Tg embryo, respectively, in comparison to control embryos (E, G); expression of EGFP fluorescence labels glomerulus (G), neck (N), proximal convoluted tubule (PCT) and exocrine pancreas. (I) Quantification of pronephric cyst formation in control embryos (3 independent experiments; n = 39, n = 59 and n = 59 analysed embryos, respectively), MZtulp3 embryos (n = 59, n = 59 and n = 59) and MZtulp3 embryos + HTULP3 (n = 59, n = 59 and n = 59) at 2dpf. (J) Quantification of altered positioning of the exocrine pancreas in control embryos (3 independent experiments; n = 39, n = 59 and n = 59 analysed embryos, respectively), MZtulp3 embryos (n = 59, n = 59 and n = 59) and MZtulp3 embryos + HTULP3 (n = 59, n = 59 and n = 59) at 2dpf. (K) Quantification of otolith deposition defects in control embryos (3 independent experiments; n = 101, n = 83 and n = 83 analysed embryos, respectively) and MZtulp3 embryos (n = 76, n = 92 and n = 112) at 2dpf. (L) Quantification of ventral body curvature in control embryos (3 independent experiments; n = 39, n = 59 and n = 59 analysed embryos, respectively), MZtulp3 embryos (n = 59, n = 59 and n = 59) and MZtulp3 embryos + HTULP3 (n = 59, n = 59 and n = 59) at 2dpf; total number of embryos used for analyses are shown above respective bar.
|
