
Fig. 7
- ID
- ZDB-FIG-250917-26
- Publication
- Rombouts et al., 2025 - Mechanistic origins of temperature scaling in the early embryonic cell cycle
- Other Figures
- All Figure Page
- Back to All Figure Page
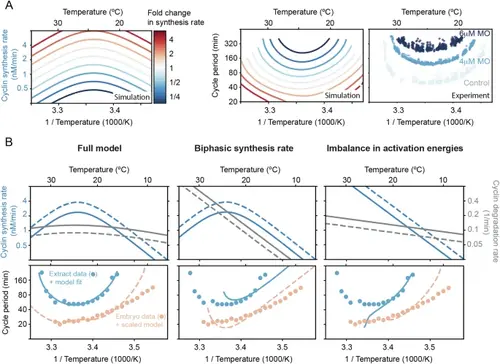
Decreasing the cyclin synthesis rate decreases the viable temperature range. A Influence of changing the basal cyclin synthesis rate by a factor up to 5 on the shape of the temperature response curves. The degradation rate is scaled up to a factor of 3. The two left panels show simulations of the 2-ODE model of the cell cycle oscillator using a parameter set obtained from the ABC method (one of the gray lines in Fig. 5B), plotting the temperature-dependence of the cyclin synthesis rate and the corresponding cell cycle period. The right panel shows the cell cycle duration as a function of temperature obtained from encapsulated extracts with 0, 4, or 6 μM morpholino (MO) oligonucleotides against isoforms of Xenopus cyclin B1/B2 mRNA species, thus lowering the cyclin synthesis rate. B Different scenarios in temperature dependence of cyclin synthesis and degradation lead to different non-Arrhenius scaling of cell cycle oscillations. While a biphasic cyclin synthesis rate leads to a double exponential response curve, the imbalance in activation energies introduces a curved non-Arrhenius response at lower temperatures, which is critical for reproducing the experimental data measured in frog egg extract. Source data are provided as a Source Data file98. |