
Fig. 4
- ID
- ZDB-FIG-250917-23
- Publication
- Rombouts et al., 2025 - Mechanistic origins of temperature scaling in the early embryonic cell cycle
- Other Figures
- All Figure Page
- Back to All Figure Page
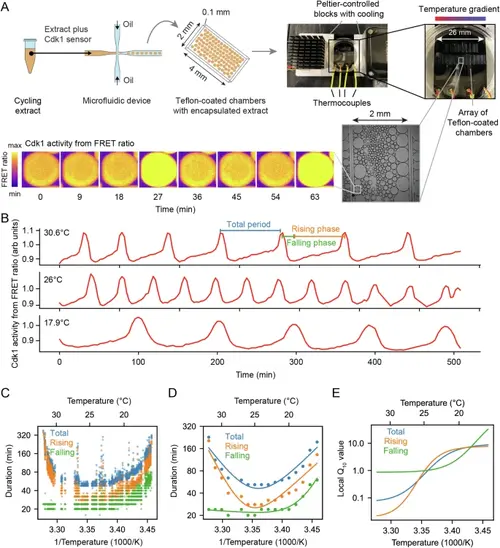
The durations of interphase and M-phase scale differently and non-Arrhenius with temperature in cycling frog egg extracts. A Sketch of the setup to encapsulate cycling frog egg extracts in droplets surrounded by oil, including pictures of the customized device to control temperature of extract droplets with snapshots of measured FRET ratios in an example droplet. B Representative time series of measured FRET ratios at different temperatures. C Analysis of the duration of the total cell cycle (blue), the rising phase (orange), and the falling phase (green) in function of temperature. D Median per temperature bin (rounded to integers) of the data shown in panel (C). Optimal fits using a double exponential function are overlayed. E Local Q10-value as a function of temperature, calculated from the fitted double exponential function. Source data are provided as a Source Data file96,98. |