
Fig. 3
- ID
- ZDB-FIG-250917-22
- Publication
- Rombouts et al., 2025 - Mechanistic origins of temperature scaling in the early embryonic cell cycle
- Other Figures
- All Figure Page
- Back to All Figure Page
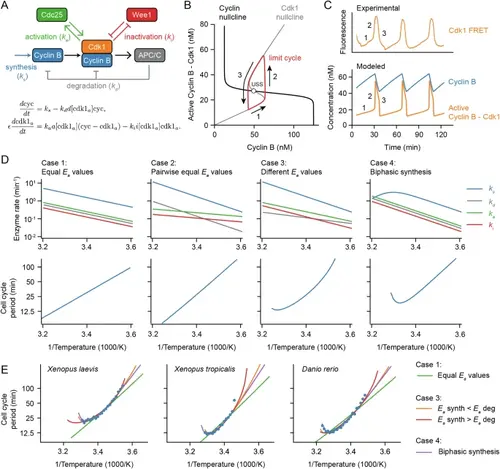
A simple relaxation oscillator model for the early embryonic cell cycle can reproduce the observed non-Arrhenius scaling. A Sketch of key reactions in the early cell cycle regulatory network. B, C Phase plane representation (B) and time series (C) of cell cycle oscillations in Eq. 4. D Scenarios showing how different temperature scaling of cell cycle regulatory processes can lead to Arrhenius scaling and/or thermal limits in the scaling of the cell cycle period. E Best fits of models presented in panel (D) to the measured data for the early cell cycle duration for X. laevis, X. tropicalis and D. rerio shown in Fig. 2. For case 3, the apparent activation energies for ks and kd need to be different to fit the data well. For Case 4, we introduced a biphasic response in cyclin B synthesis (ks). For parameter values and more details about the model, see Supplementary Note 3. Source data are provided as a Source Data file96. |