
Figure 4—figure supplement 1.
- ID
- ZDB-FIG-250901-17
- Publication
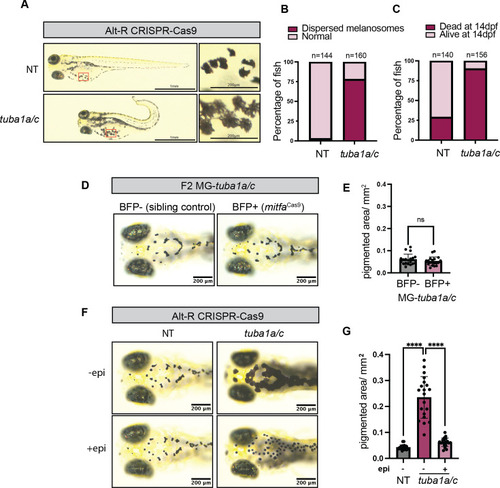
- Perlee et al., 2025 - Identifying in vivo genetic dependencies of melanocyte and melanoma development
- Other Figures
-
- Figure 1—figure supplement 1.
- Figure 1—figure supplement 1.
- Figure 2—figure supplement 1.
- Figure 2—figure supplement 1.
- Figure 3.
- Figure 4—figure supplement 1.
- Figure 4—figure supplement 1.
- Figure 5—figure supplement 1.
- Figure 5—figure supplement 1.
- Figure 6—figure supplement 1.
- Figure 6—figure supplement 1.
- All Figure Page
- Back to All Figure Page
( |