
Fig. 6
- ID
- ZDB-FIG-250825-66
- Publication
- Ostenrath et al., 2025 - Inhibition mediated by group III metabotropic glutamate receptors regulates habenula activity and defensive behaviors
- Other Figures
- All Figure Page
- Back to All Figure Page
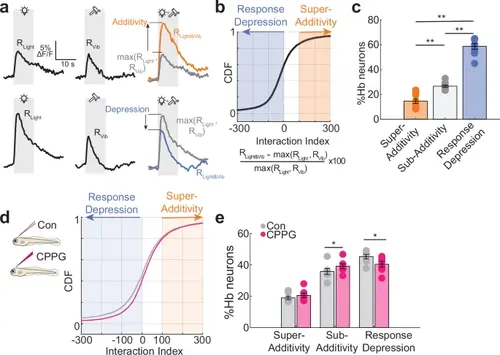
The role of group III mGluRs in multi-sensory stimulus competition in zebrafish habenula. a Example traces of habenula neurons responding to light, vibration and light and mechanical vibrations simultaneously. Upper traces show an example of additivity (orange), where combined light+vibration response (RLight&Vib) is larger than the largest individual light and vibration responses (RLight and RVib black). Bottom traces show an example of depression (blue) where combined light+vibration response is smaller than the largest of individual light or vibration responses (black). In grey, the maximum response (either light or vibration, max(RLight,RVib)) is shown. Grey traces near colored traces show the comparison of combined response to the largest of either light or vibration responses. b Cumulative distribution function of the interaction index for all habenula neuron in each fish (n = 5242 neurons in 9 fish). Values below 0 (blue shadow) are classified as response depression, values above 100 (orange shadow) are classified as super-additivity. Values between 0 and 100 are classified as sub-additivity. Data points above 300 and below −300 are not shown. c Percentage of neurons in categories of super-additivity, sub-additivity and response depression after calculation of the interactive index. There are significantly more neurons showing response depression than super-additivity or sub-additivity (n = 9 fish, Super-Additivity vs Sub-Additivity **p = 0.0039, Sub-Additivity vs Response Depression **p = 0.0020, Super-Additivity vs Response Depression p = 0.0020, one-sided Wilcoxon signed-rank test). d Interactive index of habenula neurons from control-injected (grey, n = 3732 neurons in 7 fish) and 5 mM CPPG-injected fish (pink, n = 4024 neurons in n = 7 fish). Data points above 300 and below −300 are not shown. e Percentage of neurons falling into the categories after calculation of the interaction index. Significantly less neurons show response depression in CPPG-injected fish as well as more cells falling into the sub-additivity category. (Control n = 7 fish, CPPG n = 7 fish, Super-Additivity p is n.s., Sub-Additivity *p = 0.0487, Response Depression *p = 0.0189, one-sided Wilcoxon rank sum test). Error bars represent mean +/- SEM. Scattered dots represent individual fish. Source data are provided as a Source Data file. |