
Fig. 4
- ID
- ZDB-FIG-250825-64
- Publication
- Ostenrath et al., 2025 - Inhibition mediated by group III metabotropic glutamate receptors regulates habenula activity and defensive behaviors
- Other Figures
- All Figure Page
- Back to All Figure Page
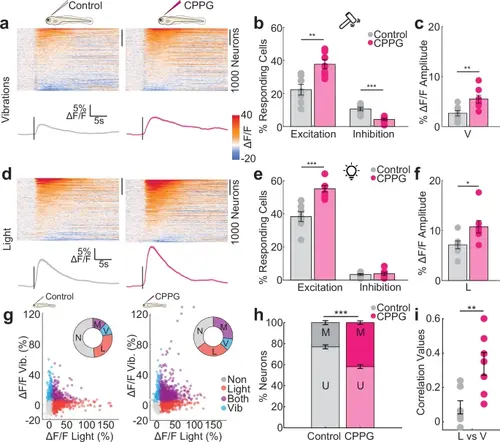
Pharmacological blocking of group III mGluRs amplifies the magnitude and reduces the selectivity of sensory responses of habenular neurons. Heatmaps represent the time courses of habenular calcium signals ( F/F) in responses to vibrations (a) or light (d) recorded by two-photon calcium imaging in Tg(elavl3:GCaMP6s) larval zebrafish. Left: control-injected (n = 3732 neurons, 7 fish) or right: 5 mM CPPG-injected (n = 4024 neurons, 7 fish). Warm colors indicate excitation, cold colors represent inhibition. Average traces of all habenula neurons are below each heatmap. Stimulus onset is indicated by a line. Shadow represents +/-SEM. Percentage of excited (2 STD above baseline) or inhibited (1 STD below baseline) habenula neurons for control (grey) or CPPG-injected (pink) fish in response to mechanical vibrations (b) or light (e) stimulation. (Control n = 7 fish, CPPG n = 7 fish, vibration: excitation **p = 0.0020, inhibition ***p = 0.0003; light: excitation: ***p = 0.0003, inhibition: p is n.s., one-sided Wilcoxon rank sum test). c,f Average F/F Amplitude (%) during the response period of all habenula neurons in each fish. (Control n = 7 fish, CPPG n = 7 fish, vibration: **p = 0.0087; light: *p = 0.0189, one-sided Wilcoxon rank sum test). g Responses of individual habenula neurons to mechanical vibration (blue), light (red) or both (magenta) for control and CPPG injected fish. The donut chart represents the ratio of habenula neurons and their response type (2 STD above baseline levels). N: non-responding, V: only vibrations, L: only light, M: both vibrations and light. h Percentage of unimodal (U) habenula neurons that respond exclusively to either light (L) or vibrations (V) versus multimodal (M) neurons responding to both light and vibrations. (Control n = 7 fish, CPPG n = 7 fish, ***p = 0.0003, one-sided Wilcoxon rank sum test). i Pearson’s correlation of multi-neuronal response vectors in the habenula for mechanical vibrations (V) and light (L) (Control n = 7 fish, CPPG n = 7 fish, **p = 0.0035, one-sided Wilcoxon rank sum test). Error bars represent mean +/- SEM. Scattered dots represent individual fish. See also Supplementary Figs. 4, 5, 6 and 7. Source data are provided as a Source Data file. |