
FIGURE
Fig. 8
- ID
- ZDB-FIG-250806-31
- Publication
- Tonelotto et al., 2025 - Characterization of a water soluble quininib prodrug that blocks metabolic activity and proliferation of multiple cancer cell lines
- Other Figures
- All Figure Page
- Back to All Figure Page
Fig. 8
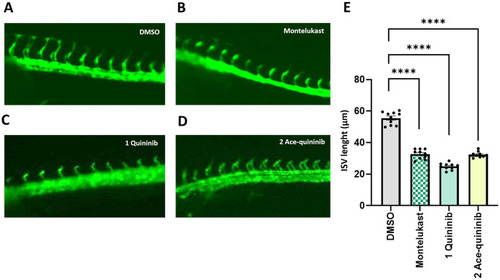
Quininib (1) and ace-quininib (2) inhibit angiogenesis in zebrafish. (A–D) Live fluorescence images of ISVs of zebrafish embryos (24 hpf) treated for 20 h with (A) DMSO 0.1 % v/v; (B) montelukast (12.5 μM), (C) quininib (1) (12.5 μM), (D) ace-quininib (2) (12.5 μM). (E) Quantification of the average length of ISV of zebrafish embryos. Embryos were treated with DMSO (0.1 % v/v), montelukast (12.5 μM), quininib (1) (12.5 μM), and ace-quininib (2) (12.5 μM). N = 10. One-way analysis of variance (ANOVA) was performed for statistical analysis. Error bars represent mean ± SEM, ∗∗∗∗p < 0.0001. N = 10. |
Expression Data
Expression Detail
Antibody Labeling
Phenotype Data
Phenotype Detail
Acknowledgments
This image is the copyrighted work of the attributed author or publisher, and
ZFIN has permission only to display this image to its users.
Additional permissions should be obtained from the applicable author or publisher of the image.
Full text @ Eur. J. Med. Chem.