
|
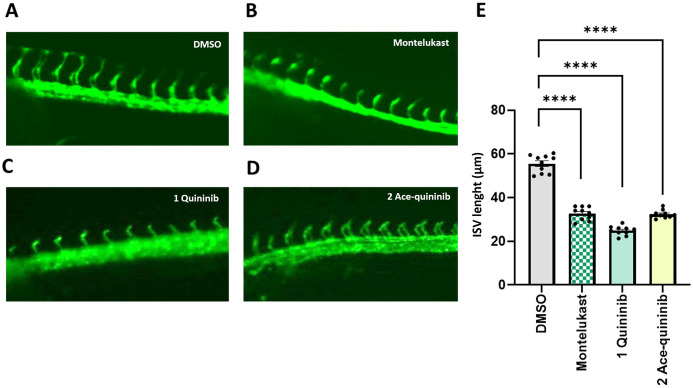
Fig. 8 Quininib (1) and ace-quininib (2) inhibit angiogenesis in zebrafish. (A–D) Live fluorescence images of ISVs of zebrafish embryos (24 hpf) treated for 20 h with (A) DMSO 0.1 % v/v; (B) montelukast (12.5 μM), (C) quininib (1) (12.5 μM), (D) ace-quininib (2) (12.5 μM). (E) Quantification of the average length of ISV of zebrafish embryos. Embryos were treated with DMSO (0.1 % v/v), montelukast (12.5 μM), quininib (1) (12.5 μM), and ace-quininib (2) (12.5 μM). N = 10. One-way analysis of variance (ANOVA) was performed for statistical analysis. Error bars represent mean ± SEM, ∗∗∗∗p < 0.0001. N = 10.