
Fig. 2
- ID
- ZDB-FIG-250714-29
- Publication
- Sepulveda et al., 2025 - Expression of a protein disulfide isomerase A3 variant associated with amyotrophic lateral sclerosis triggers disease features in mice
- Other Figures
- All Figure Page
- Back to All Figure Page
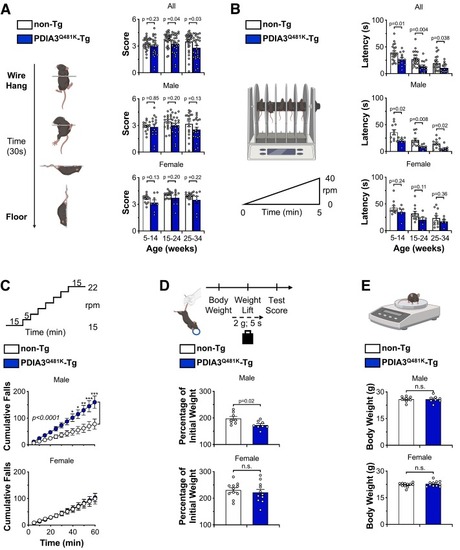
Mutant PDIA3Q481K transgenic mice present reduced motor performance. Transgenic mice overexpressing the ALS-associated PDIA3Q481K variant and their respective non-transgenic littermates were subjected to different tests to measure motor capacity. (A) In the wire hang test, the mice receive a score based on their capacity to use the four limbs and the tail to move along the hanging apparatus and climb down to the floor. Mutant PDIA3Q481K transgenic mice and non-transgenic littermates were subjected to the wire hang test weekly at the indicated age intervals in the graphs. Data on average performance from male and female mice in the period were plotted and analyzed together (All) or separately as indicated. (B) In the accelerated rotarod test, the mice run on a cylinder with constant acceleration until falling on a platform that records the running time (latency to fall). Mutant PDIA3Q481K transgenic mice and non-transgenic littermates performed the accelerated rotarod test fortnightly at the indicated age intervals in the graphs. Data of average performance from male and female mice in the period were plotted and analyzed together (All) or separately as indicated. In A and B, data are shown as mean ± s.e.m. and statistical analysis was performed using two-tailed Student's t-test. Differences with p < 0.05 were considered statistically significant and n.s. means non-significant. Each symbol in the bar graphs corresponds to an independent biological replicate. (C) In the rotarod test for endurance, the mice run on a cylinder with stepwise acceleration for a certain amount of time, and the number of falls on a platform is recorded. Mutant PDIA3Q481K transgenic mice and non-transgenic littermates performed the rotarod test for endurance at four months of age. Data from male and female mice were plotted separately and are shown as mean ± s.e.m. Statistical analysis was performed using two-way ANOVA with Bonferroni's multiple comparison test. Differences with p < 0.05 were considered statistically significant. *, p < 0.05; **, p < 0.01; ***, p < 0.001. For male analysis, F values and degrees of freedom, F (DFn, DFd): time x genotype, F (11, 143) = 7.066; time, F (11, 143) = 54.66; genotype, F (1,13) = 7.520. In the non-transgenic groups, n = 7 for males and n = 10 for females. In the transgenic groups, n = 8 for males and n = 10 for females. (D) In the weight test, the mice are suspended by the tail while holding a ring subjected to sequential weight increments. The mouse strength is expressed as the maximum weight it can hold for 5 s normalized by its body weight. Mutant PDIA3Q481K transgenic mice and non-transgenic littermates performed the weight test at four months of age. (E) The body weight of mice measured at four months of age. In D and E, data from male and female mice were plotted separately and are shown as mean ± s.e.m. Statistical analysis was performed using a two-tailed Student's t-test. Differences with p < 0.05 were considered statistically significant and n.s. means non-significant. Each symbol in the bar graphs corresponds to an independent biological replicate. |