
Fig. 1
- ID
- ZDB-FIG-250714-28
- Publication
- Sepulveda et al., 2025 - Expression of a protein disulfide isomerase A3 variant associated with amyotrophic lateral sclerosis triggers disease features in mice
- Other Figures
- All Figure Page
- Back to All Figure Page
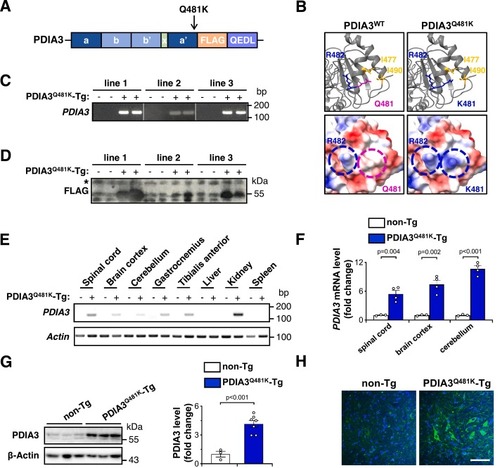
Generation of transgenic mouse lines overexpressing human PDIA3Q481K variant associated with ALS. (A) Scheme of PDIA3 transgene showing domain composition, the ALS-associated variant and sequence features. The PDIA3 variant is indicated by an arrow according to its domain localization. The catalytic domains a and a’ are represented in dark blue, and the non-catalytic domains b and b’ in light blue. The x-linker between the b’ and the a’ domains is depicted in light green. The C-terminus has a FLAG-tag (orange) and the QEDL retention signal (purple). (B) Comparison of the tridimensional structures of wild-type PDIA3 (PDIA3WT) and its ALS-associated PDIA3Q481K variant. Upper panels highlight non-polar residues close to the mutation site. Lower panels show protein surface charges highlighting the generation of a positively charged domain (blue) composed of K481 and R482 in PDIA3Q481K. (C) Analysis of mutant PDIA3 transgene expression in the spinal cord of independent transgenic mouse lines using RT-PCR. The gel was cropped for data presentation. (D) Analysis of mutant PDIA3 protein levels in the spinal cord of independent transgenic mouse lines using western blot. The asterisk indicates an unspecific band used as a loading control. (E) Detection of mutant PDIA3 transgene expression in different regions of the central nervous system and peripheral tissue of the transgenic mouse line 1 using RT-PCR. (F) Analysis of mutant PDIA3 overexpression levels in different regions of the central nervous system of the transgenic mouse line 1 using quantitative RT-PCR. Actin was employed as a housekeeping gene. (G) Analysis of mutant PDIA3 overexpression levels in the spinal cord of the transgenic mouse line 1 using Western blot. β-Actin was employed as a loading control. The graph on the right shows band densitometry quantification of PDIA3 total protein levels. In F and G, data are shown as mean ± s.e.m. and statistical analysis was performed using two-tailed Student's t-test. Differences with p < 0.05 were considered statistically significant. Each symbol in the bar graph corresponds to an independent biological replicate. Non-transgenic littermates (non-Tg) were employed as the control group. (H) Representative photomicrograph of indirect immunofluorescence analysis of mutant PDIA3 overexpression in the spinal cord of the transgenic mouse line 1. Blue, nuclei; green, PDIA3. Scale bar, 50 μm. (For interpretation of the references to colour in this figure legend, the reader is referred to the web version of this article.) |