
Fig. 6
- ID
- ZDB-FIG-250612-38
- Publication
- Mehrabi et al., 2025 - Optogenetic activation of hypothalamic AgRP neurons in transgenic zebrafish larvae increased food intake
- Other Figures
- All Figure Page
- Back to All Figure Page
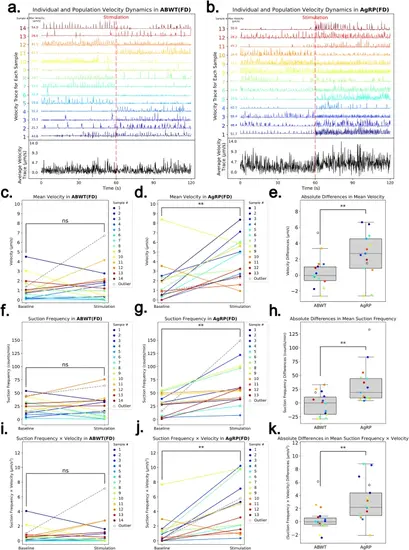
Analysis of velocity dynamics, mean velocity, mean suction frequency, and their product in food-deprived (FD) ABWT and Tg(AgRP1:ChR2-Kaede) Groups During Baseline and Stimulation Phases. (a, b) Normalized velocity traces for individual samples and the average of all samples in the ABWT (a) and Tg(AgRP1:ChR2-Kaede) (b) groups during baseline and stimulation phases. The dashed red line at 60 s indicates the transition from baseline to stimulation. The maximum velocity for each individual sample over the 120-s period is displayed alongside each sample’s plot. (c, d) Mean velocity of baseline and stimulation phases in ABWT (c) and Tg(AgRP1:ChR2-Kaede) (d) groups, with no significant difference between phases in ABWT (paired t-test, p-value: 0.89002) and a significant increase in Tg(AgRP1:ChR2-Kaede) (paired t-test, p-value: 0.00851). (e) Boxplot of differences in mean velocity of stimulation and baseline between ABWT and Tg(AgRP1:ChR2-Kaede) groups, showing a significantly higher difference in the Tg(AgRP1:ChR2-Kaede) group (independent t-test, p-value: 0.00972). (f, g) Suction frequency in ABWT (f) and Tg(AgRP1:ChR2-Kaede) (g) groups, with no significant change in ABWT (paired t-test, p-value: 0.64880) and a significant increase in Tg(AgRP1:ChR2-Kaede) (paired t-test, p-value: 0.00134) during stimulation. (h) Boxplot of absolute differences in suction frequency of baseline and stimulation, indicating significantly higher values for Tg(AgRP1:ChR2-Kaede)than ABWT (independent t-test, p-value: 0.00169). (i, j) Product of suction frequency and velocity in ABWT (i) and Tg(AgRP1:ChR2-Kaede) (j) groups, with no significant change in ABWT (paired t-test, p-value: 0.94646) and a significant increase in Tg(AgRP1:ChR2-Kaede) (paired t-test, p-value: 0.00447) during stimulation. (k) Boxplot of absolute differences in the product of suction frequency and velocity between ABWT and Tg(AgRP1:ChR2-Kaede)groups, showing significantly higher values in the Tg(AgRP1:ChR2-Kaede) group (independent t-test, p-value: 0.00287). |