
Fig. 2
- ID
- ZDB-FIG-250602-138
- Publication
- Kulkarni et al., 2025 - Competing signaling pathways controls electrotaxis
- Other Figures
- All Figure Page
- Back to All Figure Page
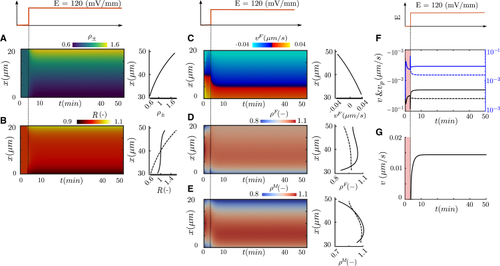
Computational results of a cell stimulated with an EF of 120 mV/mm with -potential difference of 50.76 (A–E) Kymograph of model variables along the initial cell length (Y axis) over time (X axis): CMPs polarization (A), intracellular signals (B), retrograde flow (C), actin (D), and myosin (E) densities. At the right of each panel, the CMPs, the intracellular signals (responder, solid line, and activator, dash line), the retrograde flow, actin (F-actin, solid line, G-actin, dash line) and myosin densities (bound, solid line, unbound, dash line) are shown at steady state; Retrograde flow (solid), blue and black at the cathodal and anodal sides of the cell, respectively, and polymerization velocity (dash), black and blue at the cathodal and anodal sides of the cell, respectively (F); Migration velocity of the cell (G). Color bars are differentiated by transmembrane, internal signal and actomyosin network variables. |