FIGURE

Figure 5

ID
ZDB-FIG-250530-119
Publication
Xin et al., 2025 - Transcriptomic Analysis of the Spleen from Asian Seabass (Lates calcarifer) Infected with Infectious Spleen and Kidney Necrosis Virus
Other Figures
All Figure Page
Back to All Figure Page
Figure 5

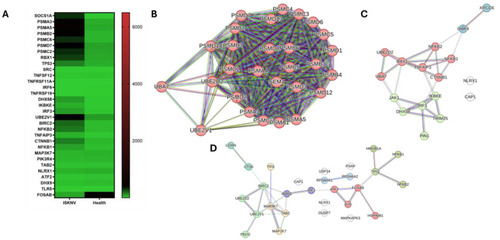
Key genes in immune response. (A) Heatmaps in TPM illustrating the expression levels of key immune-related genes. (B) PPI network of shared genes involved in antigen processing and presentation, adaptive immunity, innate immunity, and cytokine pathways. (C) PPI network of the IFN pathway. Red nodes represent the cluster of interferon-alpha/beta induction; green nodes represent the cluster of RIG-I-like receptor signaling pathway. (D) PPI network of TLR pathway. Red nodes represent the cluster of transcription factors; green nodes represent the cluster of JNK phosphorylation and activation; olive nodes represent the cluster of NF-kB activation; purple nodes represent the cluster of cytosolic DNA-sensing pathway; light sky-blue nodes represent the cluster of RSK activation.

Expression Data

Expression Detail
Antibody Labeling
Phenotype Data

Phenotype Detail
Acknowledgments
This image is the copyrighted work of the attributed author or publisher, and ZFIN has permission only to display this image to its users. Additional permissions should be obtained from the applicable author or publisher of the image. Full text @ Viruses