
FIGURE
Figure 9
- ID
- ZDB-FIG-250530-123
- Publication
- Xin et al., 2025 - Transcriptomic Analysis of the Spleen from Asian Seabass (Lates calcarifer) Infected with Infectious Spleen and Kidney Necrosis Virus
- Other Figures
- All Figure Page
- Back to All Figure Page
Figure 9
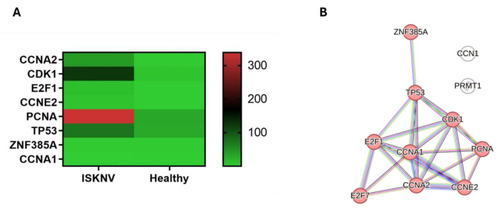
Key genes in the cell cycle arrest pathway. ( |
Expression Data
Expression Detail
Antibody Labeling
Phenotype Data
Phenotype Detail
Acknowledgments
This image is the copyrighted work of the attributed author or publisher, and
ZFIN has permission only to display this image to its users.
Additional permissions should be obtained from the applicable author or publisher of the image.
Full text @ Viruses