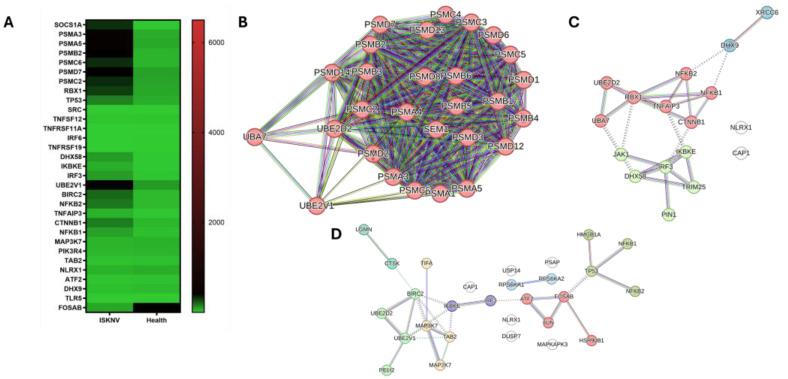
IMAGE

Figure 5

ID
ZDB-IMAGE-250530-117
Source
Figures for Xin et al., 2025
Image
Figure Caption

Figure 5

Key genes in immune response. (A) Heatmaps in TPM illustrating the expression levels of key immune-related genes. (B) PPI network of shared genes involved in antigen processing and presentation, adaptive immunity, innate immunity, and cytokine pathways. (C) PPI network of the IFN pathway. Red nodes represent the cluster of interferon-alpha/beta induction; green nodes represent the cluster of RIG-I-like receptor signaling pathway. (D) PPI network of TLR pathway. Red nodes represent the cluster of transcription factors; green nodes represent the cluster of JNK phosphorylation and activation; olive nodes represent the cluster of NF-kB activation; purple nodes represent the cluster of cytosolic DNA-sensing pathway; light sky-blue nodes represent the cluster of RSK activation.

Acknowledgments
This image is the copyrighted work of the attributed author or publisher, and ZFIN has permission only to display this image to its users. Additional permissions should be obtained from the applicable author or publisher of the image. Full text @ Viruses