
Fig. 5
- ID
- ZDB-FIG-250528-38
- Publication
- Rajamannar et al., 2025 - Neuropeptide oxytocin facilitates its own brain-to-periphery uptake
- Other Figures
- All Figure Page
- Back to All Figure Page
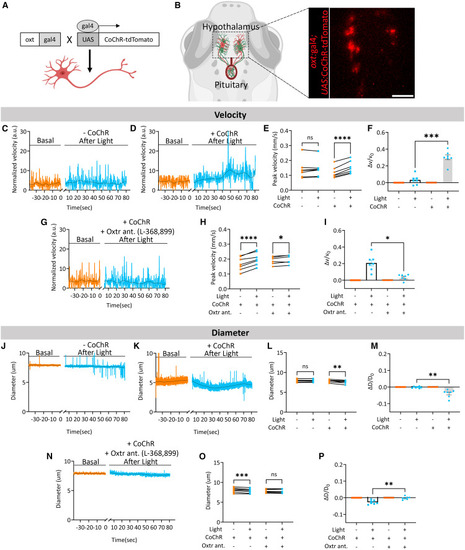
Optogenetic stimulation of oxytocin neurons increases hypophyseal blood flow and is dependent on oxytocin signaling (A and B) Scheme representing the Gal4-UAS system for expression of a blue-light-activated channel rhodopsin (UAS:CoChR-tdTomato) in oxytocin (OXT) neurons using Tg(oxt:Gal) transgenic driver. (B) Representative single z plane confocal image of OXT neurons expressing CoChR-tdTomato. Scale bar, 20 μm. (C and D) Representative blood flow velocity traces before and after light stimulation in larvae expressing CoChR show an increase in blood flow velocity as compared to their control sibling. (E) Blue light stimulation of CoChR+ larvae led to an increase in mean peak blood flow velocity (p ≤ 0.0001, paired t test, n = 7). Control CoChR− siblings were not responsive to the light stimulation (p = 0.4688, Wilcoxon test, n = 7). (F) The ratio between velocity change to basal velocity after light stimulation of the CoChR+ cohort increased as compared to their CoChR− sibling cohort (p = 0.0225, Dunn’s multiple comparison, CoChR− n = 7, CoChR+ n = 7). (G) Representative blood flow velocity traces before and after light stimulation in larvae expressing CoChR and treated with the Oxtr antagonist (Oxtr ant.) L-368,899. (H) Mean velocity after light stimulation in the CoChR+ Oxtr ant.+ larvae show an increase (p = 0.0313, Wilcoxon test, n = 7), which was also observed in their CoChR+ Oxtr ant− siblings (p ≤ 0.0001, paired t test, n = 7). (I) The ratio between velocity change to basal velocity after light stimulation in the vehicle-treated CoChR+ was significantly larger as compared to their CoChR+ siblings treated with L-368,899 (p = 0.0287, Dunn’s multiple comparison, Oxtr ant.− n = 7, Oxtr ant.+ n = 7). (J and K) Representative diameter traces before and after light stimulation in larvae expressing CoChR show an increase in blood flow velocity as compared to their control siblings. (L and M) Mean diameter after light stimulation in the CoChR+ larvae show a decrease (p = 0.0043, paired t test, n = 7) that is not observed in their CoChR− siblings (p = 0.3349, paired t test, n = 7). The ratio between diameter change to basal diameter after light stimulation in the CoChR+ cohort is lower as compared to their CoChR− sibling cohort (p = 0.0047, Dunn’s multiple comparison, CoChR− n = 7, CoChR+ n = 7). (N) Representative diameter trace before and after light stimulation in larvae expressing CoChR and treated with the Oxtr ant. L-368,899. (O) Light stimulation of CoChR+ larvae led to a decrease in mean capillary diameter (p = 0.0010, paired t test, n = 7). The capillary diameter of the antagonist-treated CoChR+ larvae did not respond to the optogenetic activation (p = 0.6043, paired t test, n = 7). (P) The ratio between diameter change to basal diameter after light stimulation of the antagonist-treated CoChR+ larvae was significantly lower as compared to vehicle-treated CoChR+ sibling cohort (p = 0.0060, Dunn’s multiple comparison, Oxtr ant.− n = 7, Oxtr ant.+ n = 7). Dashed lines in all representative traces indicate a LOWESS curve fitted to the data with a smoothing window of ten points. Data are represented as mean ± SEM. |