
Fig. 2
- ID
- ZDB-FIG-250528-35
- Publication
- Rajamannar et al., 2025 - Neuropeptide oxytocin facilitates its own brain-to-periphery uptake
- Other Figures
- All Figure Page
- Back to All Figure Page
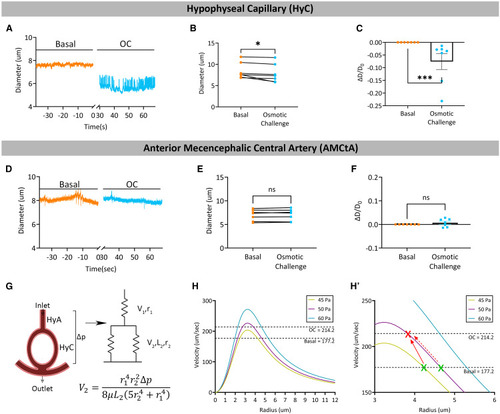
Hypophyseal vascular response is determined by its geometry (A–F) Changes in capillary diameter in the HyC (A–C) and AMCtA (D–F). Representative diameter traces of HyC (A) and AMCtA (D). Mean diameter of the capillary significantly decreases after the OC (B; p = 0.0156, Wilcoxon test, n = 7), as further shown as a ratio of diameter change to basal diameter (C; p = 0.0006, Mann-Whitney test, n = 7). (D–F) OC did not affect the mean diameter (E; p = 0.3076, paired t test, n = 7) or the ratio of diameter change to basal diameter (F; p = 0.6900, Mann-Whitney test, n = 7) of the AMCtA. Data are represented as mean ± SEM. (G) The predicted relationship between hypophyseal diameter and velocity was theoretically resolved according to Poiseuille’s law for viscous fluids by representing the individual components of the hypophyseal vascular microcircuit with an inlet-outlet pressure difference (Δp). The corresponding resistance (R), length (L), and radius (r) of the HyA and HyC are indicated. The resulting equation of hypophyseal flow velocity (V2) as a function of the above parameters is shown (G; for details, see the STAR Methods section). (H) A range of Δp was determined by multiple random matches between velocity and radius values that were obtained experimentally. This range was plugged into the resolved V2 equation, resulting in three curves, indicating the relationship between velocity and radii of the hypophyseal capillary for a given Δp. The measured average velocities before (basal) and after osmotic challenge (OC) are indicated by dashed lines (H). The point of intersection between the corresponding basal and OC velocities and the curves for a given Δp are indicated by the green and red Xs (H′). A corresponding increase in velocity following an OC requires a small increase in pressure and vasoconstriction (solid red line) or a large decrease in radius (H′, dashed red line). |