
Fig. 3
- ID
- ZDB-FIG-250528-36
- Publication
- Rajamannar et al., 2025 - Neuropeptide oxytocin facilitates its own brain-to-periphery uptake
- Other Figures
- All Figure Page
- Back to All Figure Page
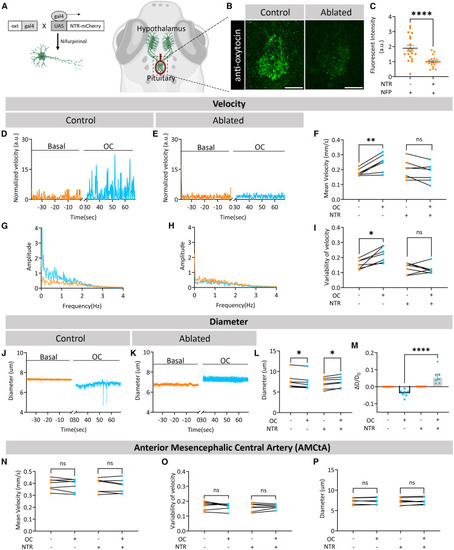
Ablation of oxytocin neurons attenuates vascular response to an osmotic challenge (A) Schema representing the transgenic Tg(oxt:Gal4;UAS:NTR-mCherry) larvae, in which oxytocin neurons express the nitroreductase (NTR) enzyme, which reduces the drug nifurpirinol (NFP) into a cytotoxic compound causing specific oxytocinergic cell death. (B and C) Tg(oxt:Gal4;UAS:NTR-mCherry) larvae were treated for 18 h with 5 μM NFP and immunostained with an antibody directed to endogenous OXT protein. NTR− (control) and NTR+ (ablated) siblings were treated with NFP, followed by anti-OXT antibody staining. Representative confocal z stack images show a reduction of OXT protein in neurohypophyseal axonal projections following NFP treatment of NTR+ larvae (B). Scale bar, 10 μm. Quantification of OXT-immunoreactive fluorescence shows a significant reduction of OXT in neurohypophyseal termini in the NTR+ cohort (C; p < 0.0001, Mann-Whitney test, control n = 19, treated n = 19). (D and E) Blood flow velocity traces representing the osmotic challenge (OC) increase in hypophyseal blood flow velocity in control (D), but not OXT-ablated (E), larvae. (F) Mean velocity after OC was increased in NTR− larvae (p = 0.0046, paired t test, n = 7) but not in their NTR+ siblings (p = 0.0947, paired t test, n = 7). (G and H) Single-sided amplitude spectra of the NTR+ cohort show no difference before and after OC as compared to the controls. (I) Variability in velocity was increased after the OC in the NTR− cohort also (p = 0.0081, paired t test, n = 7) but not in their NTR+ siblings (p = 0.5781, Wilcoxon test, n = 7). (J and K) Representative diameter traces before and after OC, showing capillary vasoconstriction of control NTR− larvae (J) compared to vasodilation of ablated NTR+ siblings (K). (L) Following OC, the hypophyseal capillary of NTR− larvae showed a decrease in diameter (p = 0.0156, Wilcoxon test, n = 7), while NTR+ larvae showed an increase in diameter (p = 0.0045, paired t test, n = 7). (M) The ratio between diameter change to basal diameter after OC was significantly different between the NTR− and NTR+ cohorts (p < 0.0001, Dunn’s multiple comparison, NTR− n = 7, NTR+ n = 7). (N–P) Mean velocity (p = 0.3941, paired t test, n = 7), variability of velocity (p = 0.6983, paired t test, n = 7), and diameter (p = 0.5249, paired t test, n = 7) of the AMCtA did not change after OC in NTR+ larvae treated with NFP. The control NTR− larvae treated with NFP also did not show any difference in mean velocity (p = 0.3095, paired t test, n = 7), variability of velocity (p = 0.5781, Wilcoxon test, n = 7), or diameter (p = 0.4430, Paired t test, n = 7) in the AMCtA after the OC. Data are represented as mean ± SEM. |