
Fig. 7
- ID
- ZDB-FIG-250526-46
- Publication
- Efthymiou et al., 2025 - Biallelic pathogenic variants in TRMT1 disrupt tRNA modification and induce a neurodevelopmental disorder
- Other Figures
- All Figure Page
- Back to All Figure Page
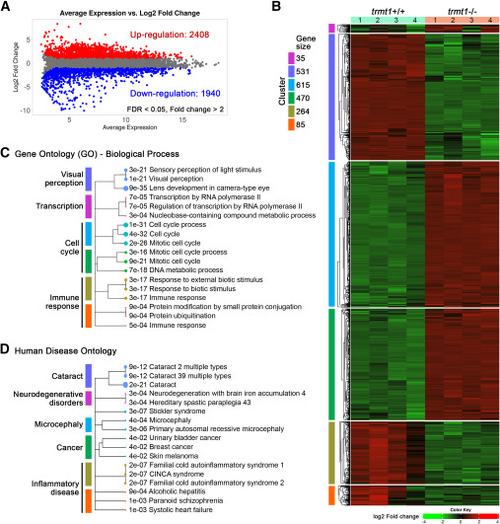
Transcriptomic analysis of Trmt1-depleted zebrafish larvae reveals differential gene expression related to multiple biological processes and human diseases (A) MA plot highlighting significant DEGs with base-2 log fold-change thresholds of ±1 and a false discovery rate (FDR) of <0.05. Red dots represent upregulated DEGs, while blue dots indicate downregulated DEGs. (B) Heatmap of the 2,000 DEGs, clustered using k-means based on their SD across all samples. Genes were grouped into six clusters, with the number of genes in each cluster shown at top left. (C) Hierarchical tree of the top three enriched GO biological process terms for each cluster, with FDR values displayed before the corresponding GO terms. (D) Hierarchical tree of the top three enriched Alliance Human Disease Ontology (DO) terms for each cluster, with FDR values placed before the DO terms. See Table S9 for detailed lists. |