
Fig. 6
- ID
- ZDB-FIG-250526-45
- Publication
- Efthymiou et al., 2025 - Biallelic pathogenic variants in TRMT1 disrupt tRNA modification and induce a neurodevelopmental disorder
- Other Figures
- All Figure Page
- Back to All Figure Page
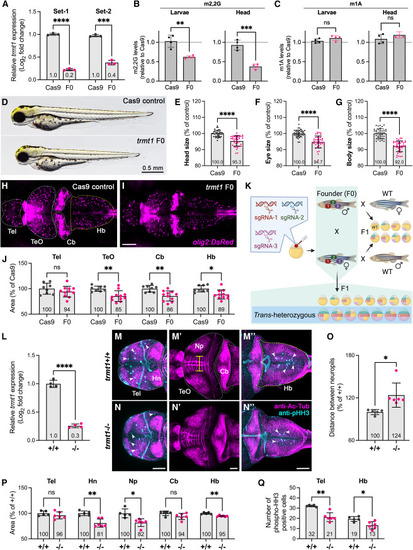
Depletion of Trmt1 in zebrafish causes developmental delay and reduced brain size due to decreased cell proliferation (A) RT-qPCR analysis of trmt1 expression in Cas9-injected control and trmt1 F0 knockout animals at 4 dpf. Expression levels were normalized to 18S and compared to the Cas9 controls. (B and C) LC-MS analysis of m2,2G or m1A in whole larvae or head-only samples. (D) Representative image for Cas9-injected control (Cas9) and trmt1 F0 knockout (F0) larvae at 3 dpf. (E–G) Quantifications of head, eye, and body sizes for Cas9 and trmt1 F0 animals (n = 40 embryos per group). Values are presented as a percentage of the mean value of Cas9 controls. Each dot represents one larva. (H and I) Representative live confocal images of Cas9 and trmt1 F0 larvae in Tg(olig2:dsRed);nacre reporter line at 5 dpf. Images are dorsal view with anterior to the left. dsRed is shown in magenta. Scale bar, 0.1 mm. (J) Quantification of brain regions as depicted in (H) for Cas9 (n = 8 larvae) and F0 (n = 11 larvae) larvae. (K) Schematic illustrating the experimental design: three sgRNAs targeting trmt1 exons were injected into one-cell-stage embryos to generate F0 knockouts. Sexually mature F0 knockouts were bred with WT fish, and the resulting F1 progeny were genotyped to identify inheritable mutant allele carriers. Positive F0 founder carriers were inbred to obtain trans-heterozygous (−/−) F1 knockout progeny. (L) RT-qPCR analysis of trmt1 expression in WT (+/+) control and trmt1 F1 knockout (−/−) larvae at 5 dpf. Experiments were performed with four biological replicates in technical triplicates. Expression levels were normalized to 18S and compared to the WT controls. (M and N) Confocal images of dissected trmt1+/+ (M to M″, n = 5 brains) and trmt1−/− (N to N″, n = 6 brains) larval brain at 5 dpf, stained with anti-acetylated tubulin (Ac-Tub, magenta) and anti-phospho-histone H3 (pHH3, cyan). (M) and (N) show the telencephalon, (M′) and (N′) show the optic tectum and cerebellum, and (M″) and (N″) show the hindbrain. Images are dorsal view with anterior to the left. Brain regions are outlined with a dotted line, and pHH3-positive cells are indicated by white arrowheads. Scale bars, 50 mm. (O) Quantification of the distance between two neuropils as indicated in (M′). (P) Quantifications of areas defined by dotted lines in (M), (M′), and (M″). (Q) Quantification of the number of phospho-histone H3-positive cells in telencephalon and hindbrain. Error bars indicate mean ± SD. For (L), (O), and (P), values are presented as a percentage of the mean value of trmt1+/+ controls. Mean values are displayed at the bottom of each bar. Statistical significance was calculated by unpaired t test with Welch’s correction: ns, non-significant (p > 0.05); ∗p < 0.05, ∗∗p < 0.01, ∗∗∗p < 0.001, ∗∗∗∗p < 0.0001. Tel, telencephalon; Hb, habenula; TeO, optic tectum; Np, tectal neuropil; Cb, cerebellum; Hb, hindbrain. |