
Fig. 3
- ID
- ZDB-FIG-250507-3
- Publication
- Liu et al., 2025 - Pulmonary mitochondrial DNA release and activation of the cGAS-STING pathway in Lethal Stx12 knockout mice
- Other Figures
- All Figure Page
- Back to All Figure Page
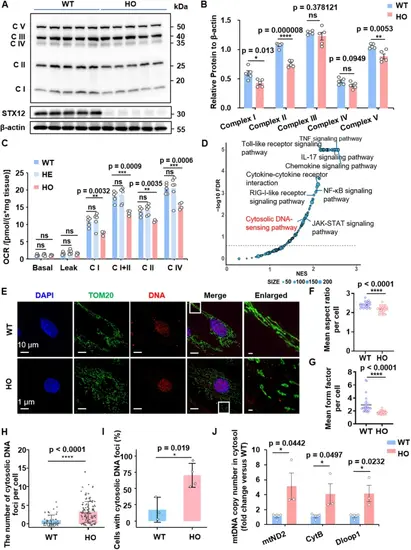
The ablation of STX12 triggers mitochondrial damage and cytosolic release of mitochondrial DNA in alveolar type II epithelial cells. A SDS-PAGE of mitochondrial OXPHOS subunits in lung lysates using OXPHOS cocktail antibodies. B Quantification of the levels of C I (complex I), C II (complex II), C III (complex III), C IV (complex IV) and C V (complex V) in Fig. 3A. The results are presented as the mean ± SEM; statistical significance was assessed by Student’s t- test. C Summarized data for the oxygen consumption capacity measured by high-resolution respirometry in Basal, C I leak, C I (complex I OXPHOS), C I + II (complex I + II OXPHOS), C II (complex II OXPHOS) and C IV (complex IV OXPHOS) (WT n = 5, HE n = 6, HO n = 4). D Volcano plots of the GSEA results, highlighting the differentially regulated pathways in Stx12−/− mouse lung tissue. FDR, false discovery rate; NES, normalized enrichment score. E Representative confocal images of immunofluorescence of primary alveolar type II epithelial cells (AEC II cells) using antibodies against TOMM20 (mitochondria) and DNA. (WT n = 4; KO n = 3 independent cultures) Boxes mark the enlarged images shown right. F The mean aspect ratio (ratio of the long axis to the short axis) of mitochondria per cell in AECII of Stx12 − / − mice (HO) versus the littermate controls (WT). WT n = 23, HO n = 40. Results are presented as mean ± SEM; statistical significance was assessed by Student’s t-test. G The mean form factor of mitochondria per cell in AECII of Stx12 − / − mice (HO) versus the littermate controls (WT). WT n = 23, HO n = 40. Results are presented as mean ± SEM; statistical significance was assessed by Student’s t-test. H, I Quantification of DNA foci: Number of cytosolic DNA foci per cell (H) and percentage of AEC II cells showing cytosolic DNA foci (I) from E. WT n = 3 HO n = 4 independent experiments. The results are presented as the mean ± SD; statistical significance was assessed by Student’s t- test. J Quantification of mtDNA copy number by qPCR using mtND2, CytB and Dloop1 primers, from isolated cytosolic fractions of AEC II cells of WT and Stx12−/− mice. The Stx12−/− mice and their littermate controls were obtained at embryonic day 19.5 (E19.5) |