
- Title
-
Pulmonary mitochondrial DNA release and activation of the cGAS-STING pathway in Lethal Stx12 knockout mice
- Authors
- Liu, D.H., Li, F., Yang, R.Z., Wu, Z., Meng, X.Y., Li, S.M., Li, W.X., Li, J.K., Wang, D.D., Wang, R.Y., Li, S.A., Liu, P.P., Kang, J.S.
- Source
- Full text @ Cell Commun. Signal.

STX12 deficiency induces mitochondrial membrane potential defects in zebrafish. A A time-course plot of percent survival in the control vs. Stx12 morphants for 3 days. dpf, days postfertilization; hpf, hours postfertilization. B Representative images of five selected stages of zebrafish embryos. Scale bar: 100 μm. C qRT-PCR for five embryo development stages (0.2 hpf, 1 hpf, 2 hpf, 3.7 hpf and 6 hpf) demonstrating different expression patterns of Stx12 during embryonic development. D Representative images of TMRM staining and AO staining in control, E4I4-MO and ATG-MO zebrafish. Treatment window: 2 hpf-3.7 hpf; Stage of image: 3.7 hpf. TMRM staining: 1 μM; AO staining: 5 μg/mL. n = 10, Scale bar: 100 μm. E Quantification of the relative TMRM fluorescence intensity. F Quantification of apoptosis particle number in AO staining of control, E4I4-MO and ATG-MO zebrafish. Image analysis was performed using ImageJ software, with n = 10 per group. G Representative images of TMRM staining and AO staining after CCCP treatment. Stage of Image: 3.7hpf. Scale bar: 300 μm. Data are presented as mean ± SEM; statistical significance was assessed by Student’s t-test |
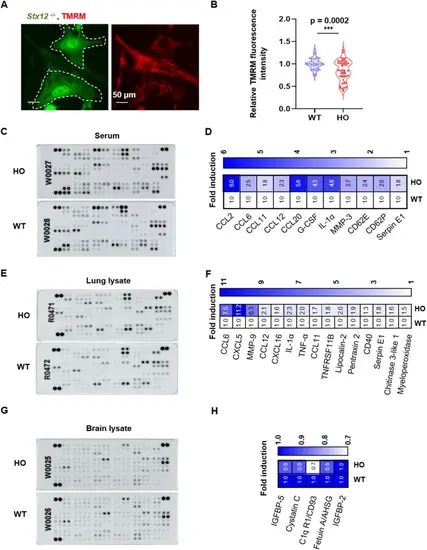
The loss of STX12 elicites an inflammatory response predominantly in lung tissue. A Representative images of TMRM staining (50 nM) of MEFs from Stx12−/− mice and littermate controls. B Quantification of the relative TMRM fluorescence intensity normalized to WT. The results are presented as the mean ± SEM; statistical significance was assessed by Student’s t- test. C, D The cytokine kit displays of serum from Stx12−/− mice (HO) and the littermate controls (WT, Stx12+/+) (R&D Systems, Catalog # 410-MT) and quantitative analysis. E, F The cytokine kit displays of lung lysates from Stx12−/− mice (HO) and the littermate controls (WT, Stx12+/+) (R&D Systems, Catalog # 410-MT) and quantitative analysis. G, H The cytokine kit displays of brain lysates from Stx12−/− mice (HO) and the littermate controls (WT, Stx12+/+) (R&D Systems, Catalog # 410-MT) and quantitative analysis. The Stx12−/− mice and their littermate controls were obtained at embryonic day 19.5 (E19.5) |
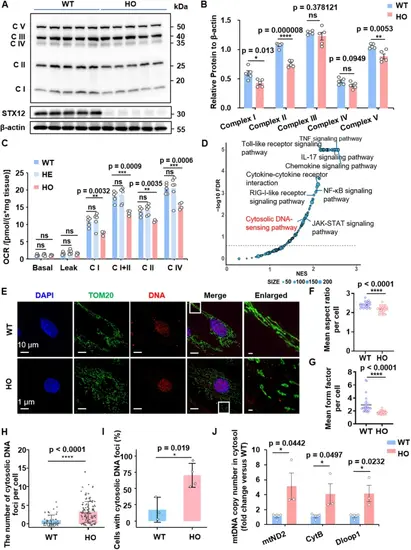
The ablation of STX12 triggers mitochondrial damage and cytosolic release of mitochondrial DNA in alveolar type II epithelial cells. A SDS-PAGE of mitochondrial OXPHOS subunits in lung lysates using OXPHOS cocktail antibodies. B Quantification of the levels of C I (complex I), C II (complex II), C III (complex III), C IV (complex IV) and C V (complex V) in Fig. 3A. The results are presented as the mean ± SEM; statistical significance was assessed by Student’s t- test. C Summarized data for the oxygen consumption capacity measured by high-resolution respirometry in Basal, C I leak, C I (complex I OXPHOS), C I + II (complex I + II OXPHOS), C II (complex II OXPHOS) and C IV (complex IV OXPHOS) (WT n = 5, HE n = 6, HO n = 4). D Volcano plots of the GSEA results, highlighting the differentially regulated pathways in Stx12−/− mouse lung tissue. FDR, false discovery rate; NES, normalized enrichment score. E Representative confocal images of immunofluorescence of primary alveolar type II epithelial cells (AEC II cells) using antibodies against TOMM20 (mitochondria) and DNA. (WT n = 4; KO n = 3 independent cultures) Boxes mark the enlarged images shown right. F The mean aspect ratio (ratio of the long axis to the short axis) of mitochondria per cell in AECII of Stx12 − / − mice (HO) versus the littermate controls (WT). WT n = 23, HO n = 40. Results are presented as mean ± SEM; statistical significance was assessed by Student’s t-test. G The mean form factor of mitochondria per cell in AECII of Stx12 − / − mice (HO) versus the littermate controls (WT). WT n = 23, HO n = 40. Results are presented as mean ± SEM; statistical significance was assessed by Student’s t-test. H, I Quantification of DNA foci: Number of cytosolic DNA foci per cell (H) and percentage of AEC II cells showing cytosolic DNA foci (I) from E. WT n = 3 HO n = 4 independent experiments. The results are presented as the mean ± SD; statistical significance was assessed by Student’s t- test. J Quantification of mtDNA copy number by qPCR using mtND2, CytB and Dloop1 primers, from isolated cytosolic fractions of AEC II cells of WT and Stx12−/− mice. The Stx12−/− mice and their littermate controls were obtained at embryonic day 19.5 (E19.5) |
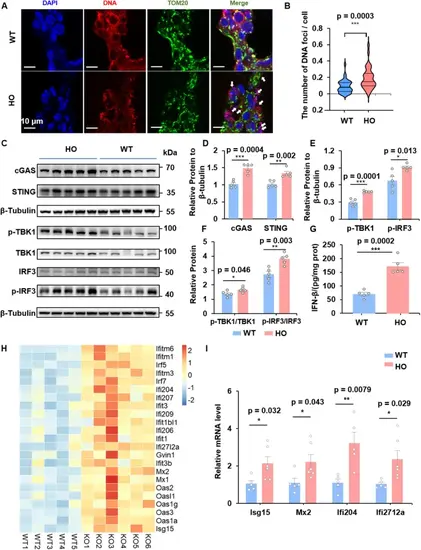
The cGAS–STING pathway and Type I interferon pathway are activated in the lung tissue of Stx12−/− mice. A Representative confocal images of immunofluorescence of frozen lung slices (30 μm) using antibodies against TOMM20 (mitochondria) and DNA. White arrowheads indicate cytosolic DNA foci. Scale bar, 10 μm. B Quantification of the average number of cytosolic DNA puncta per cell in the corresponding field. WT n = 3, KO n = 4 independent experiments. C The expression of cGAS, STING, the phosphorylation of TBK1 (p-TBK1), the phosphorylation of IRF3 (p-IRF3) and GAPDH by western blot in lung lysates from Stx12−/− and the littermate control (WT, Stx12+/+) mice. D Relative quantification of cGAS and STING levels normalized to β-tubulin. E Relative quantification of p-TBK1 and p-IRF3 levels normalized to β-tubulin. F Quantification of the levels of p-TBK1/TBK1 and p-IRF3/IRF3. G IFN-β levels of lung lysates from Stx12−/− and the littermate control (WT, Stx12+/+) mice (n = 5 per group) by enzyme-linked immunosorbent assay. H Heat map displays upregulated interferon stimulates genes (ISG) based on RNA-seq data of lung tissue. Rows represent individual ISGs and columns represent biological replicates. Color intensity reflects the level of gene expression and the values are represented as log2 fold changes. I Expression levels of ISGs by qRT-PCR from the lung tissues of Stx12−/− (n = 6) and the littermate control (WT, Stx12+/+) (n = 5) mice. The mRNA expression of target genes was normalized to that of β-actin. The Stx12−/− mice and their littermate controls were obtained at embryonic day 19.5 (E19.5). The results are presented as the mean ± SEM; statistical significance was assessed by Student’s t- test |
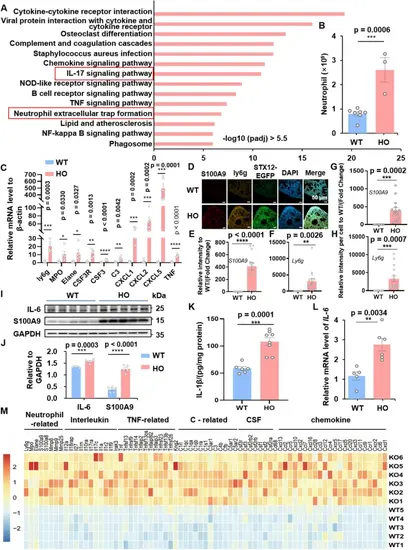
Neutrophils are involved in the severe inflammation in the lung tissue of Stx12−/− mice. A KEGG pathway analysis of the differentially upregulated expressed genes in Stx12−/− mice (-log10 (padj) > 5.5) from the RNA-seq data. B The number of neutrophils in the blood from Stx12−/− and the littermate control (WT, Stx12+/+) mice. C The relative mRNA levels of neutrophil markers (Ly6g, MPO, ELANE, and CSF3R) and key chemokines for neutrophil recruitment and activation (CSF3, C3, CXCL1, CXCL2, CXCL5, and TNF) normalized to those of β-actin. WT n = 5, HO n = 5 independent samples. D Representative confocal images of immunofluorescence of frozen lung slice using antibodies against S100A9 and ly6g, the markers of neutrophils. Their increase of fluorescence intensity indicates the infiltration of neutrophils (WT n = 4; KO n = 3). E, F Quantification of the total fluorescence intensity of S100A9 and ly6g. It is relative to normalized WT intensity. G, H Quantification of fluorescence intensity of S100A9 and ly6g per cell. It is relative to normalized WT intensity. I Western blot analysis of the expression of IL-6, S100A9 and GAPDH in lung lysates from E19.5 Stx12−/− (HO) and the littermate control (WT, Stx12+/+) mice. J Relative quantification of IL-6 and S100A9 levels normalized to GAPDH. K IL-1β levels in the lung lysate from Stx12 − / − (n = 8) and the littermate control (WT) mice (n = 6) at E19.5 by enzyme-linked immunosorbent assay. L Relative mRNA levels of IL-6 from lung lysates of Stx12−/− (HO) and the littermate control (WT) mice. M Heatmap showing upregulated inflammation-related genes including neutrophil-related gene, interleukins, tumor necrosis factor (TNF)-related genes, complement(C)-related genes, colony stimulating factor (CSF)-related genes and chemokines in Stx12−/−(HO) and the littermate control (WT) mice lung tissues. The values are represented as log2 fold changes. The Stx12−/− mice and their littermate controls were obtained at embryonic day 19.5 (E19.5). The results are presented as the mean ± SEM; statistical significance was assessed by Student’s t- test |
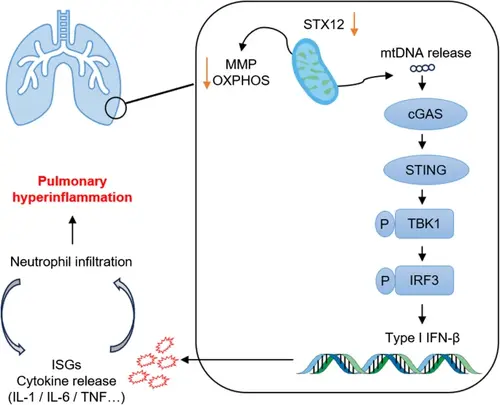
Schematic of systemic immune-inflammation in STX12-KO mice. The ablation of STX12 leads to decreased mitochondrial membrane potential (MMP), reduced expression levels of mitochondrial complex subunits, and the release of mitochondrial DNA (mtDNA). Then, mtDNA release activates the cGAS-STING-pTBK1-pIRF3 pathway, subsequently triggering Type I interferon response and downstream interferon-stimulated genes (ISGs) and cytokines in lung tissue. Additionally, cytokines release and neutrophil infiltration mutually enhance each other, resulting in an amplified cascade of hyperinflammation, referred to as “cytokine storm”, which potentially contributes to the mortality observed in Stx12 knockout mice |