
Fig. 6
- ID
- ZDB-FIG-250430-164
- Publication
- Garcia-Peiro et al., 2025 - Dendritic Platinum Nanoparticles Shielded by Pt-S PEGylation as Intracellular Reactors for Bioorthogonal Uncaging Chemistry
- Other Figures
- All Figure Page
- Back to All Figure Page
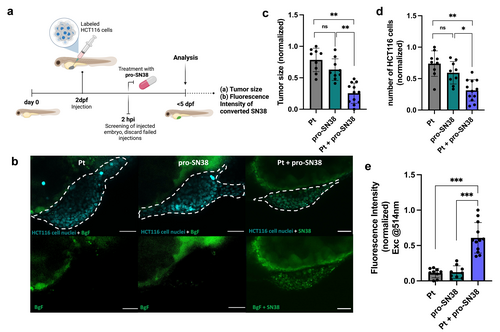
a) Schematic timeline of the Pt(0)-mediated prodrug activation in vivo assay (created with BioRender). dpf: days post-fertilization; hpi: hours post-injection. b) Confocal microscopy images of nuclei-labeled HCT116 cells (cyan) implanted in the PVS of 2-dpf zebrafish larvae after 2 days of incubation in E3 medium with or without pro-SN38. Groups: non-Pt-treated cells+pro-SN38 (left); PEG-dPt-2-treated cells+DMSO (middle), and PEG-dPt-2-treated cells+pro-SN38 (left). N=9–12. The dashed line represents the tumor area. Scale bars=50 μm. BgF: Background fluorescence. c, Measurement of tumor size between groups after treatment. d) Analysis of the number of nuclei-labeled cancer cells between groups after treatment. e) Quantitative analysis of green fluorescence signal (Ex=514 nm). Statistical analysis: one-way ANOVA followed by Tukey's post-hoc test: ns>0.05, * P≤0.05, ** P≤0.01, *** P≤0.001. |