
Fig. 2
- ID
- ZDB-FIG-250421-57
- Publication
- Zhu et al., 2024 - Receptor binding and tortuosity explain morphogen local-to-global diffusion coefficient transition
- Other Figures
- All Figure Page
- Back to All Figure Page
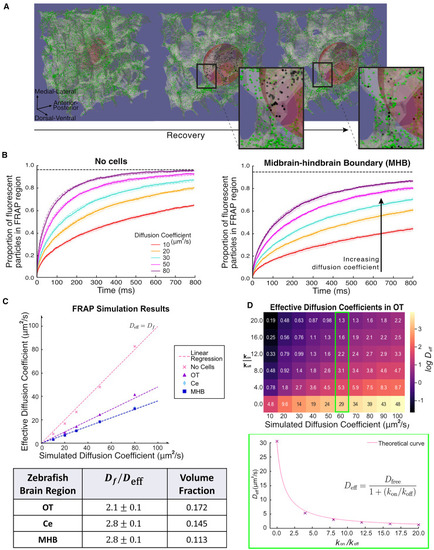
In silico FRAP simulations. (A) Example outputs of simulated FRAP measurements in the OT of the zebrafish brain, represented by the white translucent skeleton. Green and black dots represent discrete fluorescent and photobleached molecules, respectively. Red sphere represents photobleached region of radius 6 μm. The second and third panels are zoomed in by a factor of two compared to left hand panel, to better visualize the FRAP region during recovery. The insets show a close-up of particles diffusing in a tortuous environment, showing the distribution of bleached and fluorescent particles before and after recovery. (B) Recovery curves for molecules with input μm2/s for simulations without cells and midbrain-hindbrain boundary environments (solid lines and shaded regions represent the mean and standard deviations of simulated experiments, respectively). The curves are generated from 10 experiments consisting of simulating 20,000 independent particles in parallel. Each simulation is fitted with Soumpasis diffusion (Eq. (5)) (dashed lines) to obtain average diffusion time constant, . Black horizontal dashed lines represent the maximum intensity, the recovery curve will converge to since the system is conserved. (C) Results of the measured effective diffusion coefficients, , for different regions in the zebrafish brain obtained from recovery curves such as in (B). The table shows the average factor decrease in effective diffusion coefficient, which is the reciprocal of the gradients of the fitted dashed lines. Volume fraction indicates the proportion of the ECS volume to the volume of the full tissue segment. (D) Heatmap of the effects of transient binding. Values indicate the measured using the same technique, for different values of and input diffusion coefficient . The Color of the heatmap is on log scale. Lower panel shows as a function of , with simulation results (crosses) and theoretical curve (solid line). |