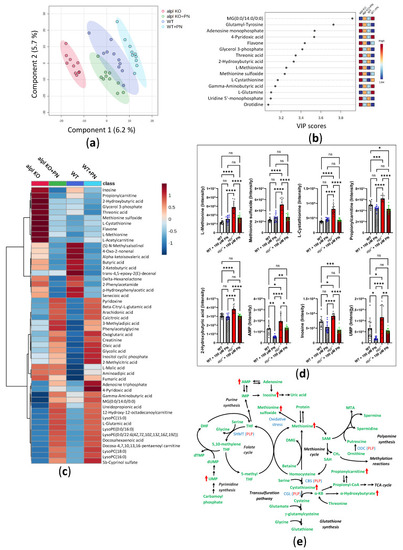
Global metabolic response to pyridoxine (PN) treatment in 5 dpf old WT and alpl-/- zebrafish embryos. (a) Partial least squares-discriminant analysis (PLS-DA) scores plot (principal component 1 (x-axis) and component 2 (Y-axis)). The explained variances are shown in brackets. 95% confidence intervals are shown for each group. (b) Important metabolites identified by PLS-DA for principal component 1. Metabolites with the highest variable importance in projection (VIP) scores are shown. The colored boxes on the right indicate the relative intensity of the corresponding metabolite in each group. (c) Heatmap visualization of group-average intensities of the 50 highest-ranking metabolites based on one-way ANOVA results. Euclidean distance and Ward’s clustering algorithm were used for the hierarchical clustering of metabolites. (d) Intensities of a selection of the highest-ranking metabolites based on one-way ANOVA results. Data are means from n = 10 pools (3 embryos per pool) per genotype and treatment group ± SD. **** p < 0.0001, *** p < 0.001, ** p < 0.01, * p < 0.05, and ns—not significant (p > 0.05); comparisons as indicated in the graphs. (e) Schematic visualization of metabolic pathways where strongest effects of Alpl deficiency were observed followed by normalization after pyridoxine treatment. Metabolites are shown in green; red arrows indicate the effect of Alpl deficiency. Key PLP-dependent enzymes are shown in blue: SHMT, serine hydroxymethyltransferase (EC 2.1.2.1); CBS, cystathionine-β-synthase (EC 4.2.1.22); CGL, cystathionine γ-lyase (EC 4.4.1.1); ODC, ornithine decarboxylase (EC 4.1.1.17).
|
