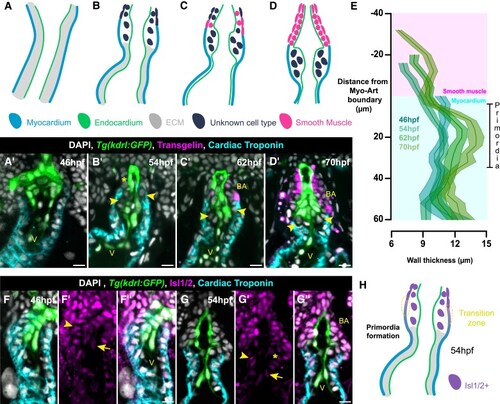
Arterial valve primordia form at the transition zone. (A–D) Schematics of OFT at 46 hpf (A), 54 hpf (B), 62 hpf (C), and 70 hpf (D). (A′–D′) Representative midline sections of Tg(kdrl:GFP) (endocardium, green) embryos stained for Tagln (smooth muscle, magenta), cardiac troponin (myocardium, cyan), and DAPI (white) between 46 and 70 hpf. At 46 hpf (A and A′), the entire OFT is myocardial (n = 12); at 54 hpf (B and B′), there is a region distally that is not myocardial and does not express Tagln (asterisk); some cells are identifiable between the endocardium and myocardium (arrowheads) (n = 15). By 62 hpf (C and C′), the region distal to the myocardium begins to express Tagln (n = 9), which is more robust; at 70 hpf (D and D′) (n = 11), this is the bulbus arteriosus. Cells present between the endocardium and myocardium do not express any markers (C′ and D′ arrowheads). (E) Quantification of wall thickness, averaged across left and right, with distance along OFT measured relative to myocardial-arterial boundary (46 hpf, n = 24; 54 hpf, n = 30; 62 hpf, n = 18; 70 hpf, n = 22). The primordia of the arterial valve form at the distal-most point of the ventricular myocardium. (F–G″) Representative midline resin section of Tg(kdrl:GFP) (green), stained for cardiac troponin (cyan), Isl1/2+ cells (SHF, magenta), and DAPI (white) at 46 hpf (F–F″, n = 14) and 54 hpf (G–G″, n = 14). (F–F″) At 46 hpf, both cardiomyocytes (arrowhead) and endocardium (arrow) at the distal end of the OFT are Isl1/2+ (n = 14). (G–G″) At 54 hpf, cardiomyocytes (arrowhead) and endocardium (arrow) of the distal OFT are Isl1/2+, whilst cells of the forming primordia are Isl1/2 (asterisk), but do not express myocardial or endocardial markers. The forming bulbus arteriosus is also SHF derived. (H) Summary of expression data, confirming the presence of the transition zone at the arterial pole (yellow region) as the site of primordia formation. E, mean ± SEM; V, ventricle; BA, bulbus arteriosus. Scale bars: 10 μm.
|
