
Fig. 2
- ID
- ZDB-FIG-250409-32
- Publication
- Raterman et al., 2024 - foxe1 mutant zebrafish show indications of a hypothyroid phenotype and increased sensitivity to ethanol for craniofacial malformations
- Other Figures
- All Figure Page
- Back to All Figure Page
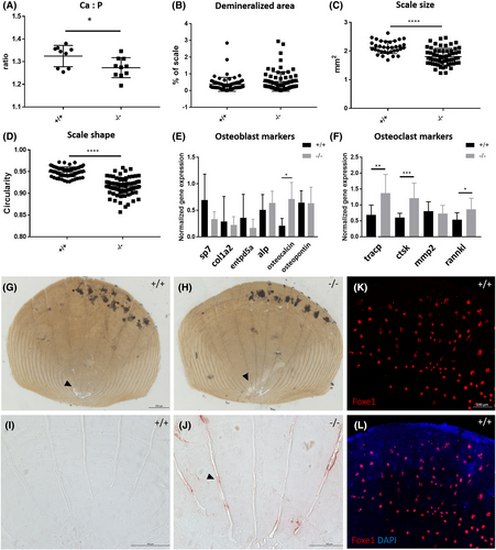
Scales of foxe1 mutants show increased osteoclast activity and Foxe1 expression. (A) The Ca:P ratio of scales is lower in mutants than in foxe1 wild types. (B) The demineralized areas of the scales were not significantly larger in mutants than in wild types. (C) The scales of mutants were reduced in size compared to the wild types. (D) The shape of the scales of mutants was less round compared to wild types. (E) Gene expression of osteoblast markers on wild type and mutant scales. (F) Gene expression of osteoclast markers on wild type and mutant scales (n = 12). (G, H) Wild type and mutant scale stained with Von Kossa to visualize mineralization, unmineralized areas (arrowheads) did not differ between mutant and wild type scales, but the shape and size of the scale was affected. (I, J) TRAcP staining (arrowhead) shows increased osteoclast activity in mutant scales. (K, L) Foxe1-positive cells at the posterior side of scales in wild type zebrafish, Foxe1 signal and merge. Scale bar (G, H) 200 μm, (I–L) 100 μm. Data were analyzed with a Student's t-test (in case of two groups) or two-way ANOVA or Kruskal-Wallis test (in case of more than two groups), where appropriate. |