|
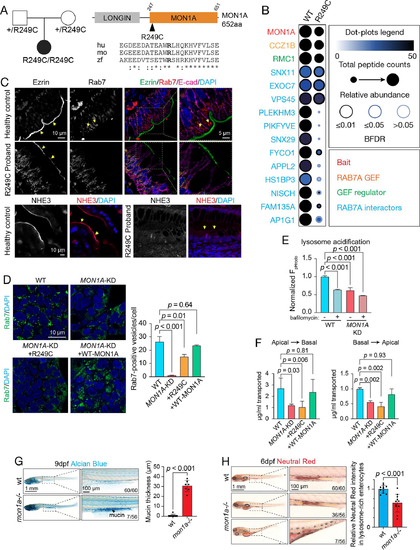
Genetic and Functional Studies of MON1A Variants. A. Trio WES identified biallelic variants in MON1A in a CODE proband. Pedigree is on the left, and a schematic illustration of the protein domain architecture is on the right, highlighting the amino acid change and its conservation across species: human (hu), mouse (mo), and zebrafish (zf). B. ProHits-viz Dot Plot diagram depicting BioID data for select proximity interactors of the MON1A WT and CODE variant proteins, as described in Figure 2e. C. (upper) Immunofluorescence images for healthy control and R249C MON1A proband tissue showing Ezrin (greyscale and green), RAB7 (greyscale and red), E-cadherin (magenta) and DAPI (blue). Arrows show reduced Ezrin at the apical brush border and loss of RAB7 positive vesicles in R249C MON1A tissue. (lower) Immunofluorescence images for healthy control and R249C MON1A proband tissue showing NHE3 (greyscale and red). Arrows show that NHE3 is localized on the apical brush border in control tissue and loss of brush border localization in R249C MON1A proband tissue. D. (Left) Representative images of wildtype HT-29-cells, MON1A, MON1A knockdown (MON1A-KD), or MON1A knockdown with expression of patient-variant R249C MON1A protein, or wild-type MON1A protein showing RAB7 (green) and cell nuclei (blue). (right) Summary graphs of RAB7+ vesicle size and count per cell. Statistical differences were determined by ordinary one-way ANOVA with multiple comparisons. Mean ± SEM, N = 3 experiments. E. Lysosome acidification in HT-29 cells using phRODO-EGF in MON1A wildtype or MON1A knockdown (MON1A-KD) +/− bafilomycin. Data is presented as percentage of MON1A. Statistical differences were determined by ordinary one-way ordinary one-way ANOVA with multiple comparisons. Mean ± SEM, N = 3 experiments. F. Polarized epithelial transcytosis of IgG in MDCK-FcRn cells. Summary of FcRn-dependent IgG concentrations crossing epithelium either from apical to basolateral (left) or basolateral to apical (right) in MON1A knockdown (MON1A-KD) MDCK-FcRn cells, and MON1A knockdown (MON1A-KD) MDCK-FcRn cells with expression of R249C MON1A or WT MON1A protein. Statistical differences were determined by ordinary one-way ANOVA with multiple comparisons. Mean ± SEM, N = 4 experiments. G. Representative bright-field images of wt and mon1a zebrafish at 9dpf. 12.5% mon1a−/−mutants showed high mucin secretion by alcian blue staining. Blue dots and areas indicate goblet cells and mucins in the gut. N = 56 for mon1a−/− at 9 dpf. N = 60 for wt at 9 dpf. The thickness of mucin was measured in the 12.5% mon1a−/− group, characterized by an increased mucin phenotype, and compared to wt. Statistical differences were determined by Student’s t-test. Mean ± SD, N = 7, Mean ± SD. H. 76.7% of mon1a−/− mutants displayed reduced lysosome activity in lysosome-rich enterocytes (LRE) at 6dpf. Red areas indicate the functional absorptive LREs. (N = 56 for mon1a−/− at 6dpf). The intensity of the red color for LRE cells was quantitated. Statistical differences were determined by Student’s t-test. N = 15, Mean ± SD.
|