|
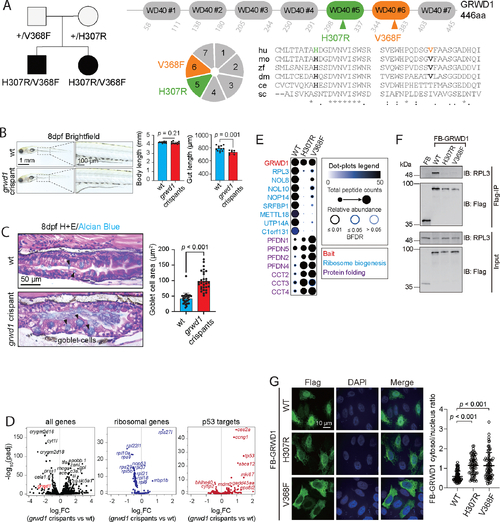
Genetic and Functional Studies of GRWD1 Variants. A. Trio WES identified biallelic variants in GRWD1 in two CODE probands. Pedigree is on the left, and cartoon depiction of the seven WD40 repeats of GRWD1 and amino acid conservation across species of the 2 variants identified in 2 CODE probands (hu, human; mo, mouse; zf, zebrafish; dm, Drosophila melanogaster; ce, Caenorhabditis elegans; sc, Saccharomyces cerevisiae). Alignments generated by clustalo; (*) conserved residues; (:) strongly similar residues; (.) weakly similar residues. B. Representative bright-field images of wt (N = 12) and grwd1 crispants (N = 10). Body length and gut length were quantitated by Fiji. Statistical differences were determined by Student’s t-test. Mean ± SD. C. Gut morphology of wt and grwd1 zebrafish crispants: Representative images of wt and grwd1 crispant zebrafish at 8 dpf with H&E and alcian blue staining, N = 6. The area of each goblet cell was measured using the Fiji selection tool to draw region of interest (N = 30). Statistical differences were determined by Student’s t-test. Mean ± SD. D. Volcano plot comparing RNA-sequencing data between wt and grwd1 crispants at 8 dpf (N = 15 pooled larvae/group, duplicated, GRCz11 annotation, DESeq2 Wald, adjusted p = 0.01). All genes and subsets of differentially expressed ribosomal protein and p53-signaling genes are displayed. E. ProHits-viz Dot Plot diagram depicting BioID data for select proximity interactors of the WT and CODE variant GRWD1 proteins. Dot size indicates relative abundance of each interacting partner detected across each of the three “bait” proteins. Dot shade indicates total peptide counts detected for each interactor, and the shade of the ring surrounding each dot (blue to black) indicates the confidence level (Bayesian False Discovery Rate) of each indicated bait-prey interaction. Interactors grouped by functional annotation, as indicated. For statistical analysis, a Bayesian FDR was assigned to identified proteins using SAINT (v3.6.1; 20 BirA*Flag-only controls compressed to 4). F. HEK293 T cells were transfected with either Flag-BirA* alone or a Flag-BirA* tagged GRWD1 protein (WT or CODE variant, as indicated). Flag-tagged proteins were precipitated with Flag Agarose Affinity Gel and eluates analyzed by western blotting, using antibodies directed against the Flag epitope or the RPL3 protein. Data are representative of 3 independent experiments. G. Hela cells expressing Flag-BirA*- GRWD1 WT, H307R, or V368F proteins were fixed and stained for Flag epitope (green) and DAPI (blue). Scale bar 10μm. GRWD1 cytosol/nucleus signal ratio was calculated using Volocity. Statistical differences were determined by Student’s t-test. Error bars represent SD from 3 independent experiments, with >70 cells analyzed.
|