|
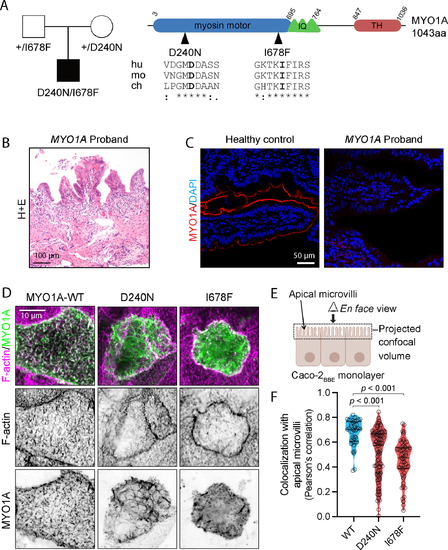
Genetic and Functional Studies of MYO1A Variants. A. Trio WES identified biallelic variants in MYO1A in a CODE proband. Pedigree is on the left, and a schematic illustration of the protein domain architecture is on the right, highlighting the amino acid change and its conservation across species: human (hu), mouse (mo), zebrafish (zf), and chicken (ch). IQ = IQ Motif, TH = Tail Homology. B. Hematoxylin and eosin staining of intestinal biopsy from the proband. C. Immunofluorescence images for healthy control and MYO1A-I678F proband tissue showing MYO1A (red) and DAPI (blue). D. Maximum intensity projections of confocal volumes showing localization of wild-type (WT), D240N, and I678F variants of EGFP-MYO1A (green) in CACO-2BBE cells, fixed and stained with phalloidin to highlight F-actin (magenta). Top row shows two-channel merge images; inverted single channel images for EGFP and phalloidin are shown beneath each merge. Scale bars, 30 μm E. Cartoon depicting orientation of the image planes shown in D relative to the CACO-2BBE monolayer and the volume sampled during confocal imaging. F. Pearson’s correlation coefficients calculated between green (MYO1A construct) and magenta (F-actin) channels on a per-cell basis; this value reflects the extent of colocalization between each expressed protein and the microvillar actin cytoskeleton. Each point represents a measurement from a single cell; N = 40, 87, 58 cells for WT, D240N, and I678F, respectively. Solid black lines denote median correlation coefficients. Statistical differences were determined by Kruskal-Wallis ANOVA test.
|