|
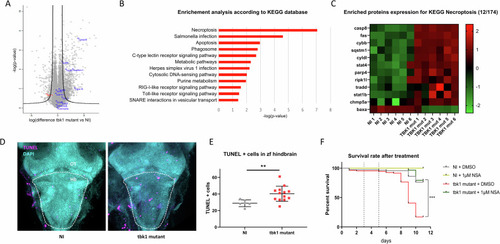
Proteomic profile and markers of programmed cell death in tbk1 mutant zebrafish. A Volcano plot showing protein enrichment measured by mass spectrometry in tbk1 mutant zebrafish at 8 dpf compared to their NI controls (black line = cutoff for statistical significance). B Pathway enrichment analysis based on KEGG 2019 for significantly enriched proteins measured in tbk1 mutant zebrafish compared to their NI controls. C Heatmap representation of protein levels (row z scores) for significantly enriched proteins associated with the KEGG term necroptosis (hsa04217) in tbk1 mutant and NI zebrafish larvae. D Terminal deoxynucleotidyl transferase dUTP nick end labeling (TUNEL) staining of cells affected by programmed cell death in the larval brain of tbk1 mutant or NI zebrafish at 6 dpf (OT, optic tectum; Hb, hindbrain; dotted line = outline of hindbrain used for quantification). E Quantification of TUNEL-positive cells in the hindbrain of tbk1 mutant or NI zebrafish (unpaired t test, p = 0.0098). F Survival rate of tbk1 mutant or NI larvae upon incubation with the necroptosis inhibitor necrosulfonamide (NSA) at 1 µM or 0.1% DMSO (log-rank (Mantel Cox) test). ***p < 0.001).
|