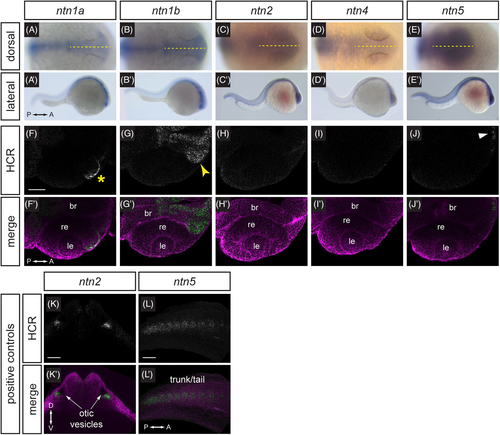
Expression patterns of netrin ligands. (A–E') Whole-mount in situ hybridization for ntn1a, ntn1b, ntn2, ntn4, and ntn5 in wild-type embryos at 24 hpf, (A–E) dorsal orientation, (A'–E') lateral orientation. Yellow dotted lines (A–E) indicate embryo midline. (F–J') HCR RNA-FISH for ntn1a, ntn1b, ntn2, ntn4, and ntn5 in wild-type embryos harboring the Tg(bactin2:EGFP-CAAX) transgene at 24 hpf. (F-J) HCR signal alone. (F'–J') Merge of HCR (green) and Tg(bactin2:EGFP-CAAX) transgene (magenta) to visualize tissue morphology. Yellow asterisk (F) indicates ntn1a signal in the nasal margin of the optic fissure; yellow arrowhead (G) indicates ntn1b signal in the optic stalk; white arrowhead (J) indicates faint ntn5 in the telencephalon. (K-L') HCR RNA-FISH positive controls for ntn2 and ntn5 in wild-type embryos harboring the Tg(bactin2:EGFP-CAAX) transgene at 24 hpf. (K, K') ntn2 expression in otic vesicles. (L, L') ntn5 expression in the trunk and tail. (K-L) HCR signal alone. (K', L') Merge of HCR (green) and Tg(bactin2:EGFP-CAAX) transgene (magenta) to visualize tissue morphology. br, brain; le, lens; re, retina. Scale bar, 50 μm.
|
