
Figure 7.
- ID
- ZDB-FIG-250307-16
- Publication
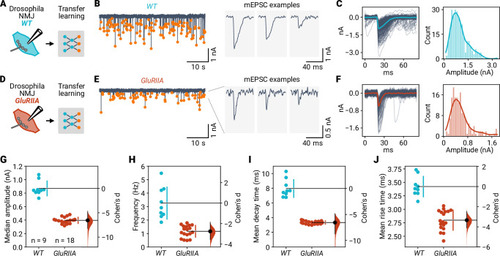
- O'Neill et al., 2025 - A deep learning framework for automated and generalized synaptic event analysis
- Other Figures
-
- Figure 1—figure supplement 1.
- Figure 1—figure supplement 1.
- Figure 1—figure supplement 2.
- Figure 2—figure supplement 1.
- Figure 2—figure supplement 1.
- Figure 2—figure supplement 2.
- Figure 2—figure supplement 3.
- Figure 3—figure supplement 1.
- Figure 3—figure supplement 1.
- Figure 4—figure supplement 1.
- Figure 4—figure supplement 1.
- Figure 5—figure supplement 1.
- Figure 5—figure supplement 1.
- Figure 5—figure supplement 2.
- Figure 6.
- Figure 7.
- Figure 8.
- Figure 9—figure supplement 1.
- Figure 9—figure supplement 1.
- Figure 9—figure supplement 2.
- All Figure Page
- Back to All Figure Page
( |