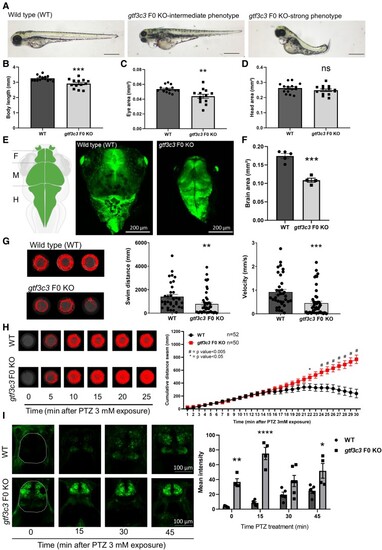
Modelling gtf3c3 KO in zebrafish recapitulates patients’ clinical features. (A) Morphology of zebrafish WT, and gtf3c3 F0 KO larvae at 3 dpf. Scale bars: 500 µm. Body length (B), head size (C) and eye size (D) of WT and gtf3c3 F0 KO larvae at 3 dpf (n = 13–15). (E) Schematic representation and image of transgenic (Tg) GFAP:GFP head in dorsal view of 3-dpf WT and gtf3c3 F0 KO larvae. Scale bar: 200 μm. (F) Quantification of brain size of gtf3c3 F0 KO larvae (3 dpf, n = 4) compared to WT (3 dpf, n = 5) showed a significant reduction that could reflect microcephaly. (G) Representative swimming tracks, and quantification of swimming and velocity of WT (n = 36) control and gtf3c3 F0 KO (n = 48) fish at 5 dpf. (H) Representative swim traces of control WT fish and gtf3c3 F0 KO followed through time with PTZ treatment at 4 dpf. Quantification of swimming distance with PTZ treatment normalized to fish without treatment showed that gtf3c3 F0 KO (n = 50) larvae exhibited seizure-like behaviour after 15 min of PTZ treatment compared to WT (n = 52). (I) Neuronal activity induced by PTZ treatment (3 mM; 0, 15, 30 and 45 min) in 4-dpf larvae analysed by imaging p-MAPK/ERK staining. Quantification of mean intensity fluorescence of p-MAPK/ERK staining in telencephalic region (surrounded in red) showed a significant increase in gtf3c3 F0 KO larvae compared to WT at 0-, 15- and 45-min treatment of PTZ. According to the neuronal activity, we can suggest that gtf3c3 F0 KO (0, 15, 30 and 45 min, n = 4–6) larvae exhibit seizure-like behaviour relative to the WT (n = 5). All data are represented as the mean ± SEM. Statistical significance was calculated by Student's t-test or Mann–Whitney test, or Sidak' multiple comparisons tests. *P < 0.05, **P < 0.01, #P < 0.005, ***P < 0.001, ****P < 0.0001; ns, not significant. n represents number of fish.
|
