
- Title
-
Biallelic variants in GTF3C3 encoding a subunit of the TFIIIC2 complex are associated with neurodevelopmental phenotypes in humans and zebrafish
- Authors
- Abdel-Hamid, M.S., Paimboeuf, A., Zaki, M.S., Figueiredo, F., Abdel-Ghafar, S.F., Maher, S., Friðriksdóttir, R., Sulem, P., Högnason, H.B., Hallgrímsdóttir, S., Rojas, C.F.N., Kok, F., Suri, M., Alves, C.A.P.F., Houlden, H., Maroofian, R., Patten, S.A.
- Source
- Full text @ Brain Commun

|

|
EXPRESSION / LABELING:
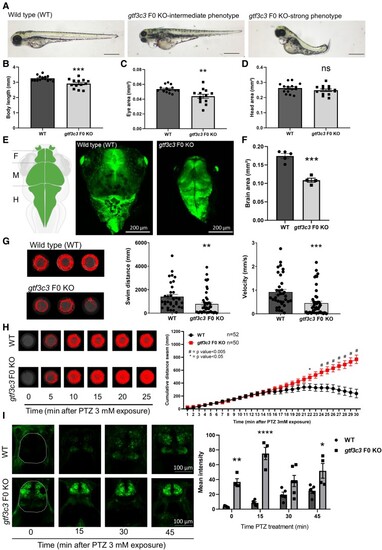
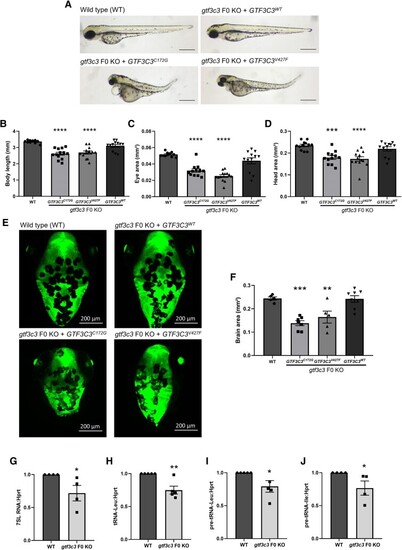
PHENOTYPE:
|
|