FIGURE

Fig. 4

ID
ZDB-FIG-250306-13
Publication
Nian et al., 2024 - Oscillatory DeltaC Expression in Neural Progenitors Primes the Prototype of Forebrain Development
Other Figures
All Figure Page
Back to All Figure Page
Fig. 4

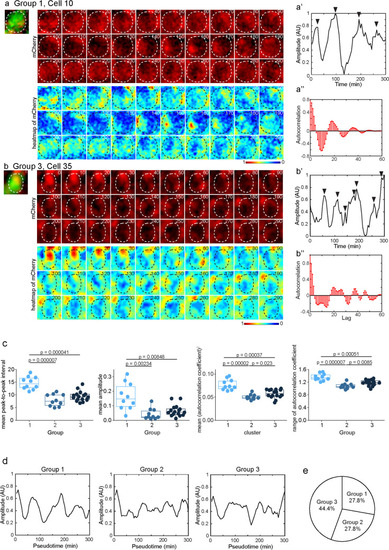
Fluctuating dlc expression was not synchronized in the developing forebrain of larval zebrafish. a, b Time-lapse imaging of mCherry signals and the heatmap of corrected mCherry signals in GFP cells (8*8 μm). Dashed lines delineate the cellular boundary of GFP cells. Time (minutes) was indicated. a’, b’ Line charts show the amplitude of mCherry signals in cell 10 (a’) and cell 35 (b’). a”, b” Curve diagrams show the autocorrelation results of cell 10 (a”) and cell 35 (b”). a, a’, a” Time-lapse imaging and the analyses of cell 10 in group 1. b, b’, b” Time-lapse imaging and the analyses of cell 35 in group 3. c Box and dot plots show the mean peak-to-peak interval, mean amplitude, mean square of autocorrelation coefficient, and range of autocorrelation coefficient in three groups. p values by Student’s t-test are indicated. d Line charts show the mean amplitude in each group. e The pie chart shows the composition of analyzed GFP cells

Expression Data

Expression Detail
Antibody Labeling
Phenotype Data

Phenotype Detail
Acknowledgments
This image is the copyrighted work of the attributed author or publisher, and ZFIN has permission only to display this image to its users. Additional permissions should be obtained from the applicable author or publisher of the image. Full text @ Mol. Neurobiol.