
Fig. 7
- ID
- ZDB-FIG-250219-7
- Publication
- Bouwman et al., 2025 - Cross-species comparison reveals that Hmga1 reduces H3K27me3 levels to promote cardiomyocyte proliferation and cardiac regeneration
- Other Figures
- All Figure Page
- Back to All Figure Page
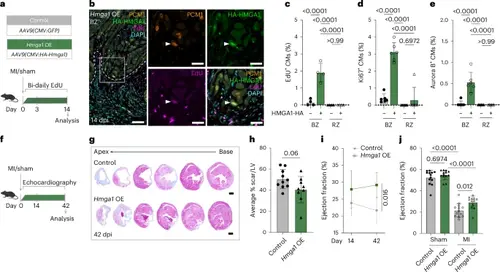
HMGA1 promotes CM proliferation and cardiac regeneration in injured adult mice. a, Schematic overview for experiments in b–e. b, Representative image of immunofluorescent staining against PCM-1, HA and EdU. Dashed line indicates the injury border. Arrowheads indicate HMGA1-HA+EdU+ CMs. Scale bars, 100 μm in overview and 20 μm in zoom-in. c–e, Quantification of EdU+ (c), Ki67+ (d) and Aurora B+ (e) CMs within the BZ and RZ of hearts transduced with HA-HMGA1. n = 4 hearts were analyzed for EdU and n = 6 for Ki67/Aurora B quantification. Datapoints represent individual hearts. Error bars indicate mean ± s.d. Statistics were performed using a one-way ANOVA followed by Tukey’s multiple comparisons test and show significant differences for % EdU+/Ki67+/AuroraB+ CMs in HMGA1-HA+ BZ CMs compared to HA− BZ CMs and RZ HA+/− CMs (P < 0.0001 for all). No significant difference was found between RZ HA− and HA+ cells for % EdU+ CMs (P > 0.99), % Ki67+ CMs (P = 0.6972) and % AuroraB+ CMs (P > 0.99). f, Workflow for mouse experiments in g–j. g, Representative images of control and Hmga1 OE hearts at 42 dpi stained with Masson’s trichrome. Distance between sections is 400 μm. Scale bars, 1 mm. h, Quantification of scar size in control (n = 10) and Hmga1 OE (n = 9) hearts at 42 dpi showing average % MI length/midline LV length. Error bars indicate mean ± s.d. Statistics were performed by two-tailed unpaired t-test and show no significant difference (P = 0.06). i, Quantification of EF at 14 dpi and 42 dpi of control (n = 13) and Hmga1 OE (n = 13) hearts. Error bars indicate mean ± s.d. Statistics were performed using a two-way ANOVA followed by Sidak’s multiple comparisons test and show a significant difference (P = 0.016). j, Quantification of EF at 42 dpi of sham (n = 13 control, n = 13 Hmga1 OE) and MI (n = 13 control, n = 12 Hmga1 OE) hearts. Datapoints represent individual hearts. Error bars indicate mean ± s.d. Statistics were performed using a one-way ANOVA followed by Tukey’s multiple comparisons test and show a significant difference between control sham/MI hearts (P < 0.0001), between Hmga1 OE sham/MI hearts (P < 0.0001) and between control and Hmga1 OE MI hearts (P = 0.01) but not between control and Hmga1 OE sham hearts (P = 0.6974). |